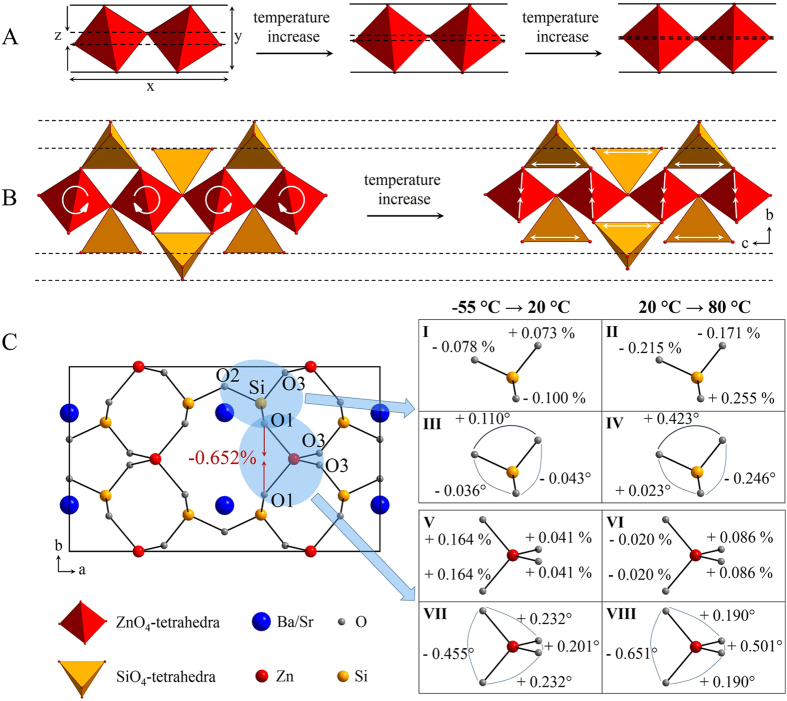
Figure 3. The origin of the negative thermal expansion in crystals with the structure of Ba0.6Sr0.4Zn2Si2O7.
(A) Movement of ZnO4-tetrahedra in a single chain. (B) Rotation and distortion inside the network. (C) Distortions of SiO4- and ZnO4-tetrahedra at different temperatures. The values were taken from single crystal X-ray diffraction measurements. On the left side, the a-b-plane of one unit cell is shown. The red arrows between two O1-atoms show the main direction of shrinkage with a shortening of 0.652% during heating from −55 °C to 80 °C. On the right side, the changes in the O-Si bond length (I, II) and the changes in the O-Si-O bond angles (III, IV) are displayed for two different temperature ranges, given in [%] and [°], respectively. By analogy it was done for the [ZnO4]2−-tetrahedra (V-VIII).

