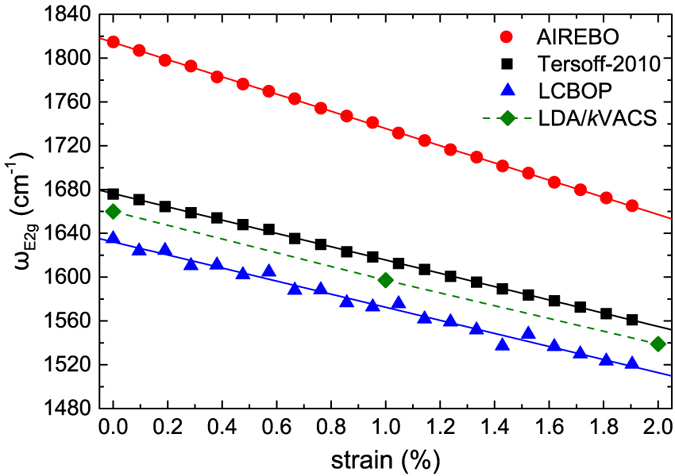
Figure 6. Evolution of the E2g phonon frequency of graphene upon equibiaxial strain calculated using the AIREBO (red circles), Tersoff-2010 (black squares), and LCBOP (blue triangles) potentials.

The solid green rhombi are data from our DFT calculation within the LDA. In all cases the frequencies were calculated using the kVACS method (see Methods section) on MD simulations at a temperature of T = 300 K.
