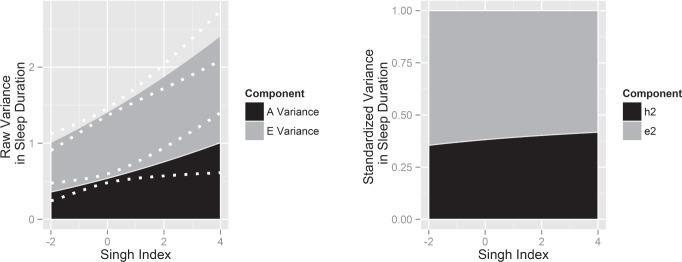
Figure 5.
Raw residual variance (left) and standardized residual variance (right) in sleep duration as a function of area-level deprivation. The stacked variance plot on the left illustrates how the (A), (E), and total residual variance in sleep duration increases with units of the Singh Index. The dotted white lines represent the 95% confidence intervals around the change in residual variance. The stacked variance plot on the right shows the proportion of total residual variance in sleep duration attributable to genetic factors (h2) and nonshared environmental factors (e2) vary as a function of the Singh Index.

