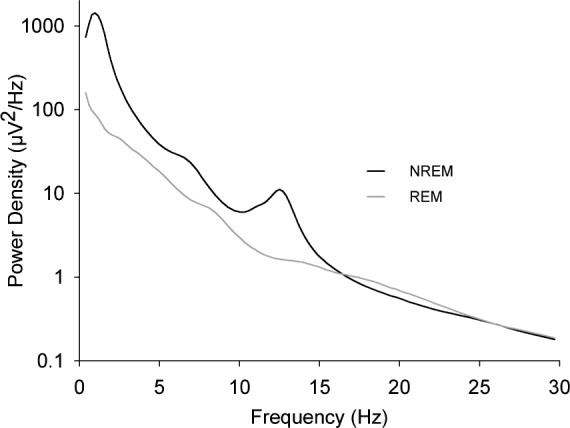
Figure 1.

Power spectra at age 12 y for electroencephalogram recorded during the first 5 h of nonrapid eye movement (NREM) sleep (black line) or during the second and third rapid eye movement (REM) periods (gray line). Mean (n = 65) power density is plotted against the midpoint of the frequency band. A peak occurs in the sigma frequency band (11–15 Hz) in NREM but not in REM sleep in each age group.
