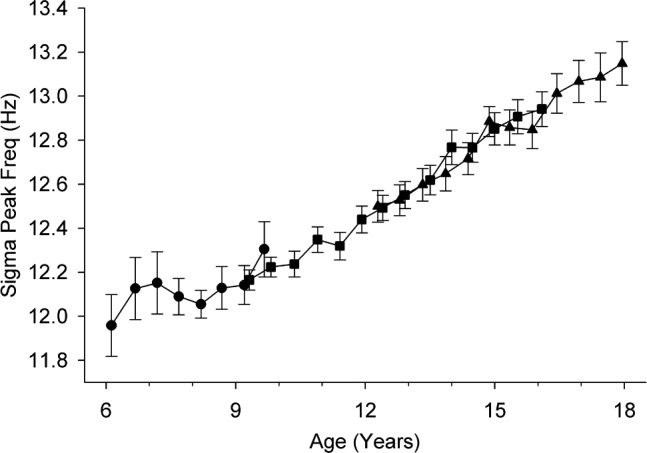
Figure 2.

Maturational trajectory of the frequency of peak sigma power. The average (± standard error) peak frequency at each semiannual recording is plotted against age for each of the three cohorts, C6 (circles), C9 (squares), and C12 (triangles). The linear increase is highly significant (F1,865 = 128, P < 0.0001).
