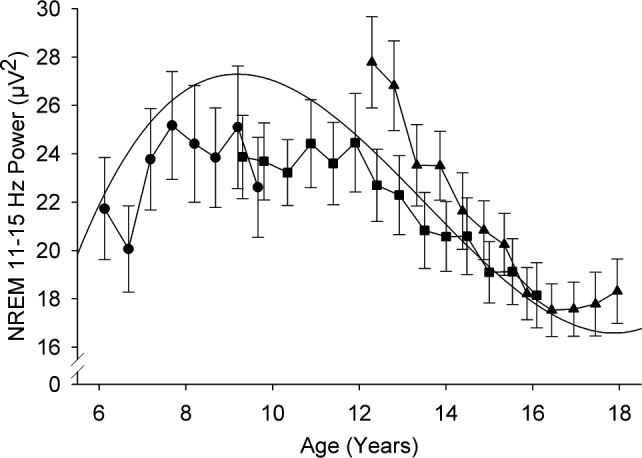
Figure 3.

Maturational trajectory of sigma power shows a power increase at younger ages followed by a steep decrease across adolescence. Average (± standard error) power at each semiannual recording is plotted against age for the three cohorts. The trend line is a cubic function fit with mixed-effect analysis.
