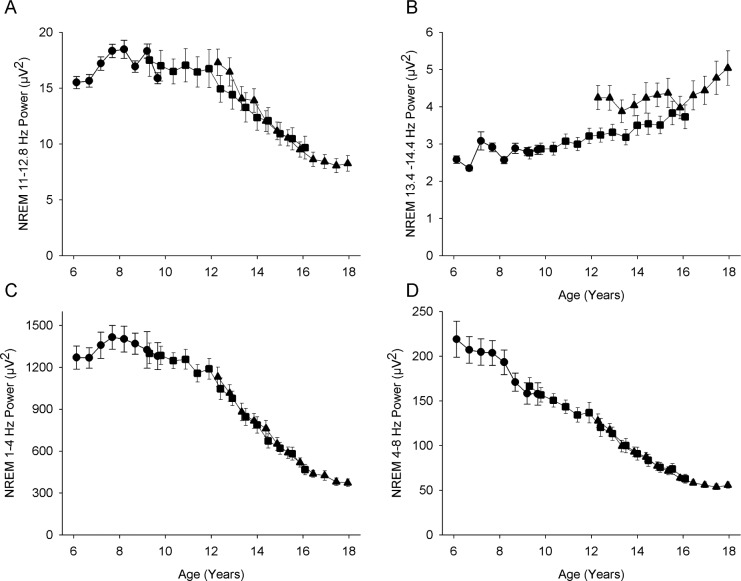
Figure 5.
Maturational trajectory of power in (A) 11.0–12.8 Hz, the frequency range that significantly decreases in power with age and (B) 13.4–14.4 Hz, the frequency range that significantly increases in power with age. Also shown for comparison are the maturational trends for (C) delta (1–4 Hz) and (D) theta (4–8 Hz) in these subjects. The trajectory for low frequency sigma power (A) strongly resembles that for delta power (C). Format as in Figure 3.

