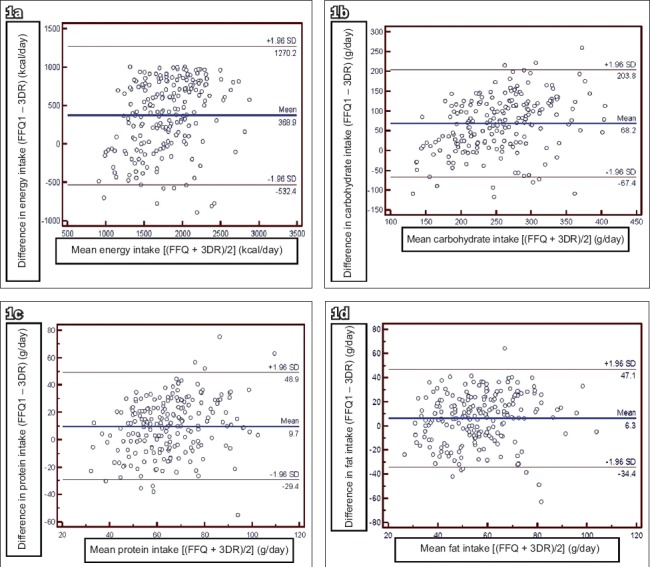
Fig. 1.

Bland-Altman plots show agreement between the first administration of the food frequency questionnaire (FFQ1) and three-day dietary records (3DR) for (a) energy; (b) carbohydrate; (c) protein; and (d) fat intake. The thicker line represents the mean difference in absolute intake between the two methods and the thinner lines represent the limits of agreement (± 2 standard deviation [SD]).
