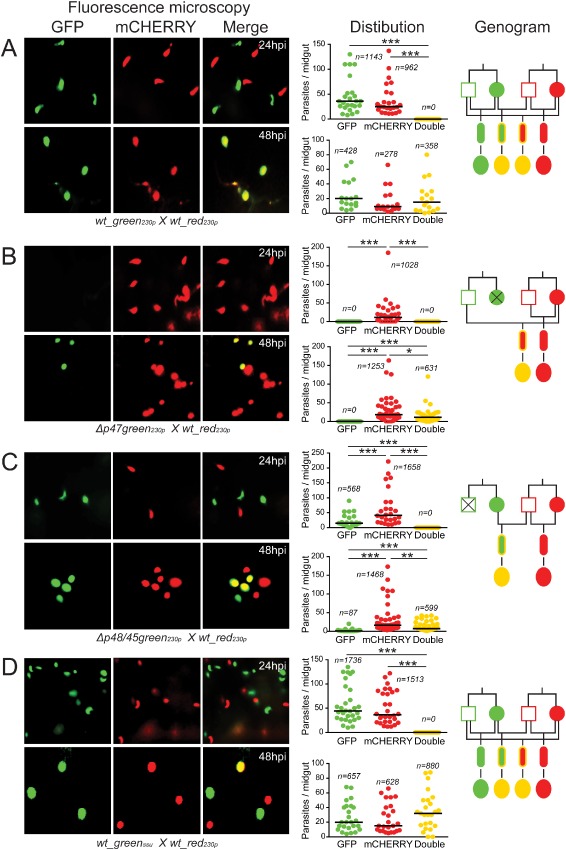
Figure 2.

Allelic expression of fluorescent reporters placed under the control of a constitutive gene promoter.
A. wt_green230p x wt_red230p.
B. Δp47green230p x wt_red230p.
C. Δp48/45green230p x wt_red230p.
D. wt_greenssu x wt_red230p. Each part consists of three panels. The first composite panel is a collection of six representative fluorescence microscopy pictures of A . gambiae midguts fed on mice co‐infected with two transgenic parasite lines as indicated at the bottom of each part, taken at 24 and 48 hpi respectively. The GFP, mCHERRY and a combination of the two channels (merge) are shown. The second panel is a graph showing the distribution and median number of GFP‐positive, mCHERRY‐positive and GFP/mCHERRY double‐positive parasites per midgut at 24 and 48 hpi. The collective results from three biological replicates are shown, where n is the total number of parasites counted. The third panel shows a genogram summarizing the results of these cross‐fertilization experiments. Squares correspond to male gametocytes, circles correspond to female gametocytes, small ellipses correspond to ookinetes and large ellipses correspond to early stage oocysts. The colour of the outline indicates the genotype, while the fill‐in colour indicates the phenotype. Yellow outline indicates gfp/m C herry heterozygotes, while yellow fill‐in colour indicates GFP/mCHERRY double‐positive parasites. Black lines indicate the crosses and the resulting progeny. Horizontal black lines indicate the median parasite number. Stars indicate statistical significance determined with the Mann–Whitney U‐test (***P < 0.001; **P < 0.01; *P < 0.05).
