Fig. 4.

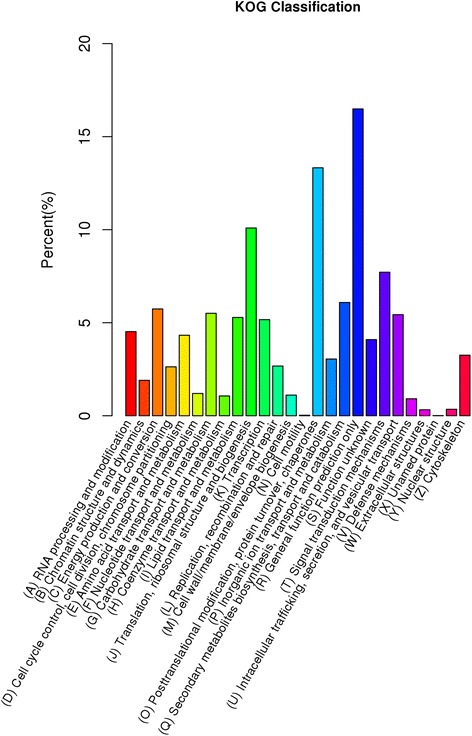
Histogram of clusters of eukaryotic ortholog groups (KOG) classification in jute. The horizontal axis is the name of clusters of KOG; and the vertical axis is the proportion of the group to the total number

Histogram of clusters of eukaryotic ortholog groups (KOG) classification in jute. The horizontal axis is the name of clusters of KOG; and the vertical axis is the proportion of the group to the total number