
Fig. 5.
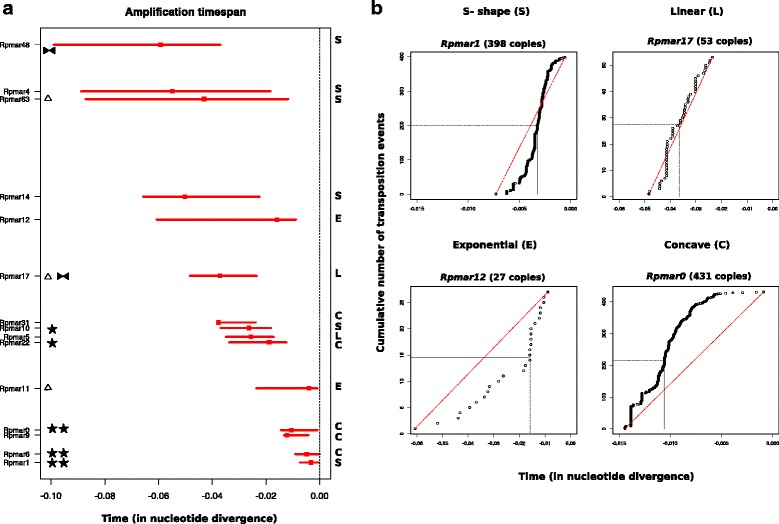
Amplification dynamics analyses of different mariner lineages found in R. prolixus. a Time-span amplification. The time span amplification is reported as a horizontal line for each lineages sorted from most recent (bottom) to most ancient (top). The position of the median transposition event is indicated by the red square. The status of each lineage appears on the left :  , internally deleted lineages.
  , lineages with a few potentially active copies.
  , lineages with numerous potentially active copies.
 : lineages with rearrangement. The type of dynamics is reported on the right (S: S-shaed, L: Linear, C: Concave, E: Exponential). b. Examples of amplification dynamics. Each curve represents a Lineage-Through-Time (LTT) plot i.e. the cumulative number of transposition events over time, measured in genetic divergence units (from present). The red dotted line represents the theoretical curve obtained for a constant rate of transposition over time. The position of the median transposition events is indicated by horizontal and vertical dotted lines. Given the very high copy number of Rpmar0, we present a plot with a random sampling of 431 copies