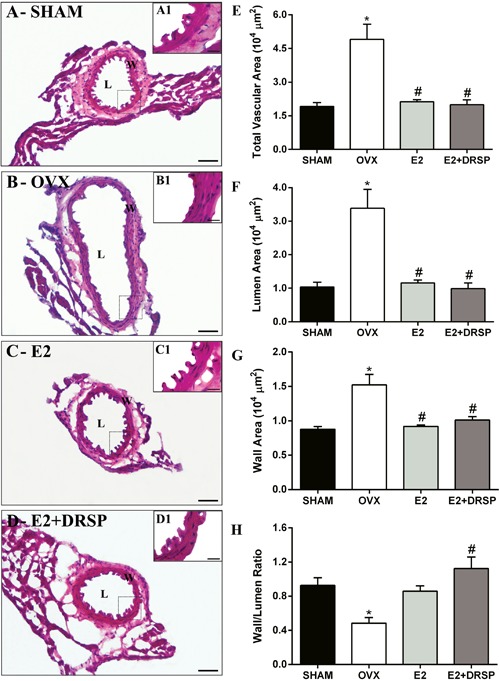
Figure 3. Histomorphometric analysis of coronary arteries from ovariectomized spontaneously hypertensive rats. Representative images of histological slices of the coronary arteries: SHAM (A and A1), OVX (B and B1), E2 (C and C1), DRSP (D and D1) groups. Total vascular area (E), lumen area (F), vessel wall area (G), and the wall to lumen ratio (H) are reported as means±SE (n=4 per group). OVX: ovariectomized; E2: estrogen; DRSP: drospirenone; L: vessel lumen; W: vessel wall; total vascular area: L+W area. *P<0.05 compared to Sham, #P<0.05 compared to OVX (one-way ANOVA followed by Tukey's post hoc test). Bars: 50 and 20 µm.