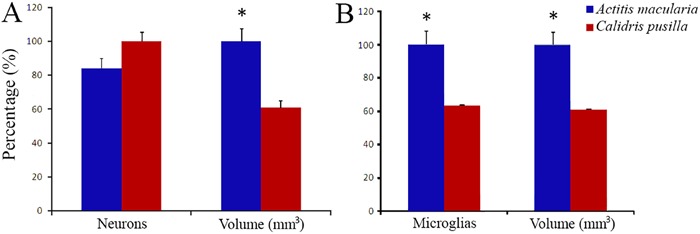
Figure 3. Neurons and microglia in the sandpiper hippocampus. A, Number of neurons and volume of the hippocampal formation reported as percentage values in Actitis macularia and Calidris pusilla (the highest value in each paired data set for the two species was assigned a value of 100%). For absolute numbers, see tables in Supplementary Material. Data are reported as means ± SE and asterisks indicate a statistically significant difference using Student’s t-test with P<0.05. B, Number of microglia and volume of the hippocampal formation in A. macularia and C. pusilla. Data are reported as means ± SE and asterisks indicate a statistically significant difference using Student’s t-test with P<0.05.

