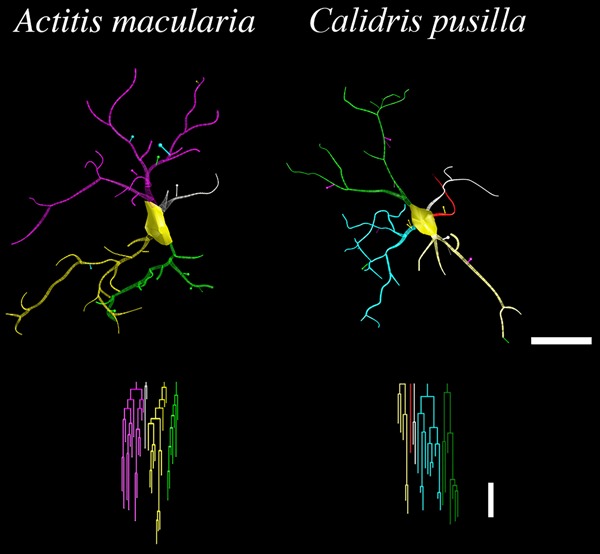
Figure 6. Microglial three-dimensional (3D) reconstructions from sandpiper hippocampus. 3D reconstructions (top) and correspondent dendrograms (bottom) of representative microglia showing differences in morphology between sandpipers. Individual branches are distinctly colored to facilitate examination. The linear dendrograms of microglial arbors show the length of each branch segment displayed to scale; sister branches are horizontally displaced. Branch colors correspond to the 3D reconstructions above. The dendrograms were plotted and analyzed using Neuroexplorer (MBF Bioscience, USA). Dendrograms scale bar=10 µm, 3D reconstructions scale bar=10 µm.

