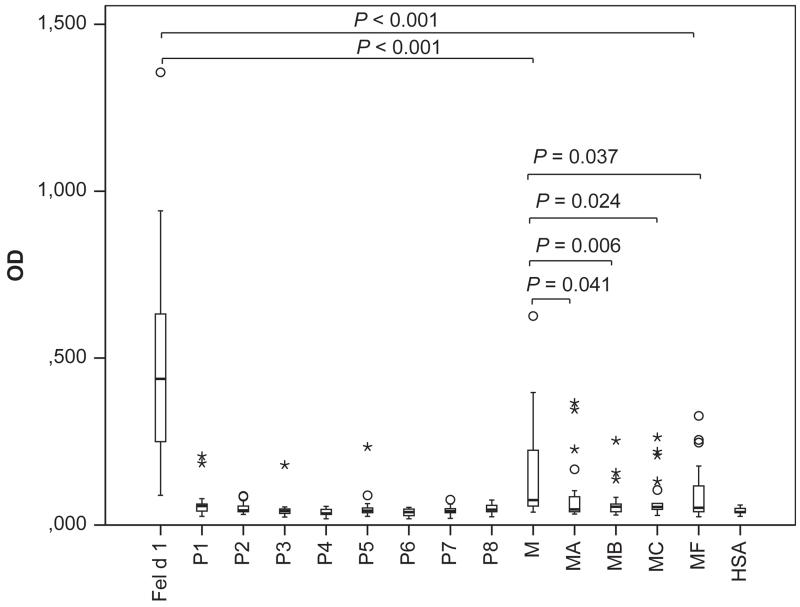
Fig. 2.
IgE reactivity of cat-allergic patients to Fel d 1, Fel d 1 peptides and derivatives as tested by ELISA in 21 patients. OD values correspond to bound IgE and are represented in box plots, where boxes mark the interquartile range containing 50% of the data and lines across the boxes indicate the median. ○ represent outliers and * are extreme values. P values are shown.

