
Fig. 5.
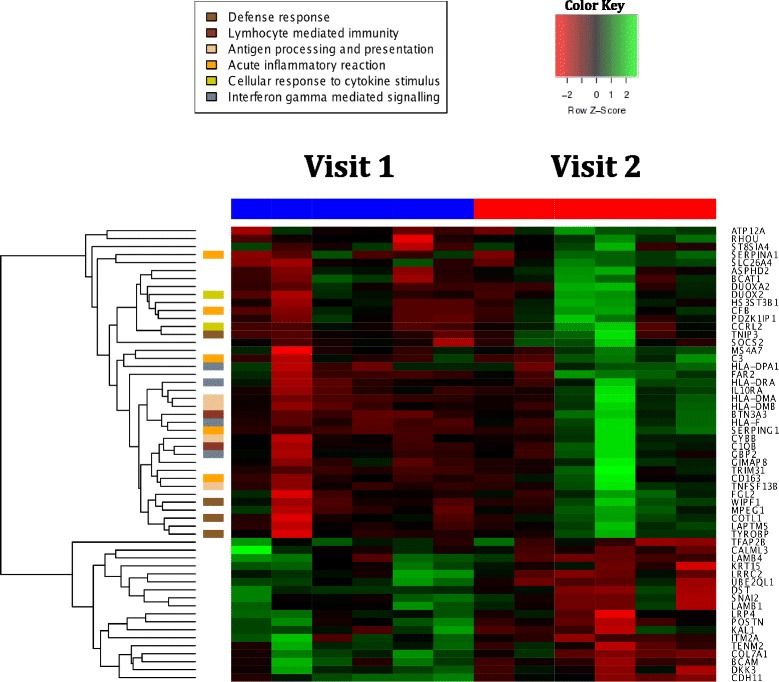
A heat map of log2 gene expression for the most differentially expressed genes in the LAIV group, selected by thresholds of p value <0.01 and log2 fold changes greater than 0.7 between visits. The left hand column shows selected gene ontology associations from the hypergeometric GO/BP analysis as described. Given significant overlap between gene ontology terms, representative groups were chosen to represent as many unique and non-overlapping GO/BP terms as possible