
Fig. 3.
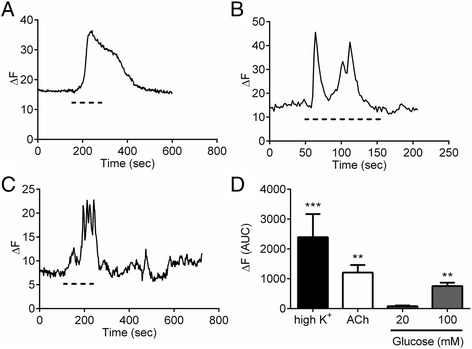
Depolarisation increases intracellular levels in EC cells. Example trace from a single EC cell representing calcium entry upon stimulation with (a) 100 mM K+, (b) 10 μM ACh, (c) 100 mM glucose as indicated with the dashed line. (d) Average EC cell fluorescence change in response to 100 mM K+ (n = 13 cells), 10 μM ACh (n = 13 cells), 100 mM glucose (n = 15 cells) and 20 mM glucose (n = 7 cells)