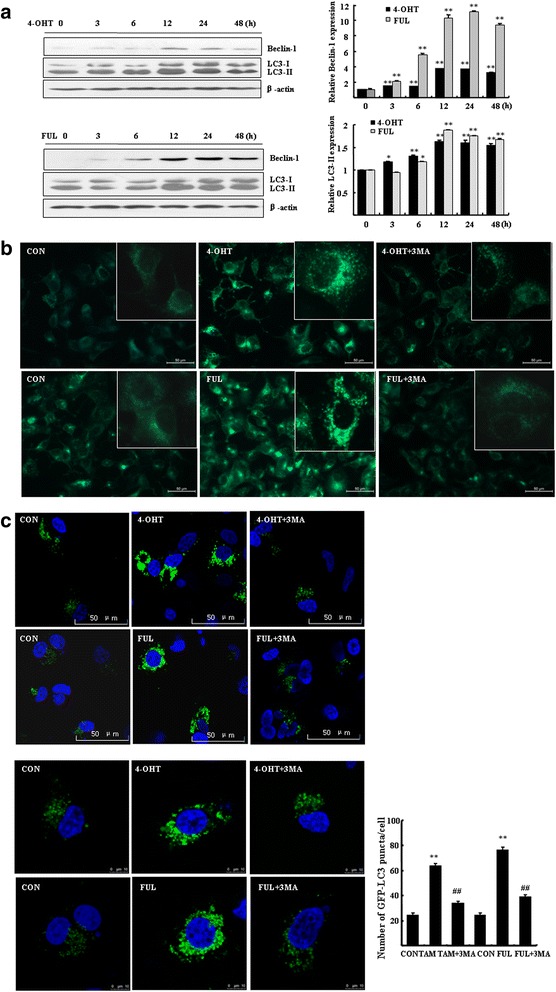
Fig. 1.

4-OHT or FUL induced autophagy in breast cancer cells. a MCF7 cells were exposed to 5 μM 4-OHT or 1 μM FUL for the indicated time. Western blotting was performed to determine the expressions of LC3 and Beclin-1. Bar graphs indicated relative levels of LC3-II and Beclin-1 normalized to β-actin. Data represent mean ± SD of three experiments. *P < 0.05, **P < 0.01 vs. vehicle control. b MCF7 cells seeded on coverslips were treated with 5 μM 4-OHT or 1 μM FUL for 48 h. After staining with MDC, cells were imaged under a fluorescence microscope (scale bar = 50 μm), with a magnified image showing punctate pattern. c MCF7 cells were transfected with GFP-LC3 for 24 h and then were treated with 5 μM 4-OHT or 1 μM FUL with or without 5 mM 3-MA for 48 h. Cells were imaged under a confocal microscopy, scale bar = 50 μm (up) or 10 μm (bottom). Numbers of GFP-LC3 puncta per cell were counted. **P < 0.01 vs. vehicle control, ## P < 0.01 vs. TAM/FUL treatment, n = 10 cells. Data represent mean ± SD of three experiments
