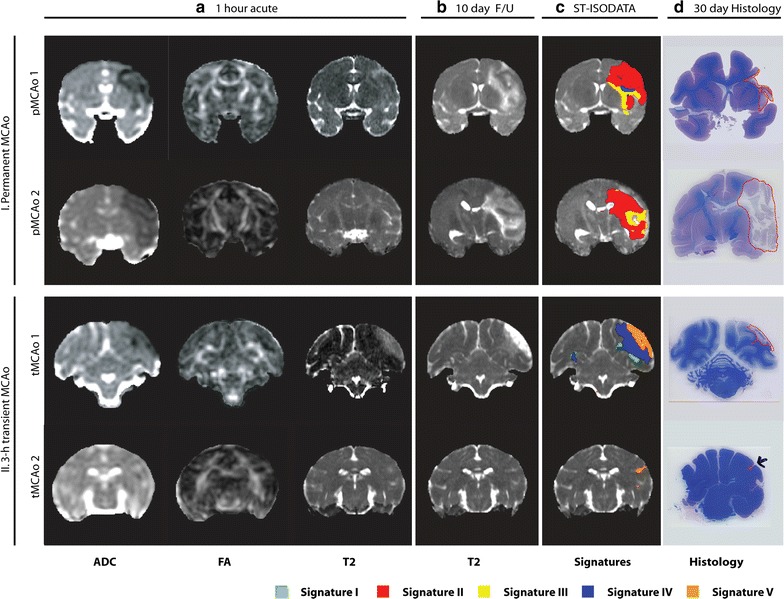
Fig. 3.

Example of coronal brain slices from macaques after permanent or 3 h transient MCAo. Quantitative ADC, FA, and T2 maps at 1 h after stroke induction (a), and 240 h follow-up T2 maps (b) of animals with permanent (I) or 3 h transient MCAo (II) are shown. For each animal the quantitative maps from 1 h up to 240 h after MCAo were combined using a ST-ISODATA approach resulting in five abnormal signatures (c; overlaid on 240 h follow-up T2 maps), that were consistent with regions of affected tissue on LFB-stained histological sections (red-outlined regions; d)
