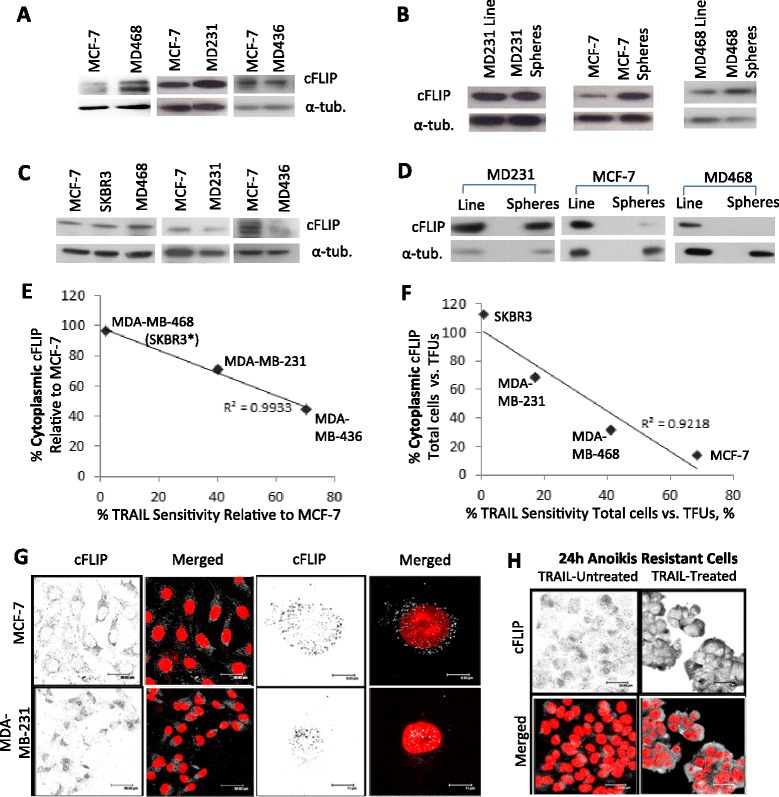
Fig. 2.

Cytoplasmic cFLIP Levels Correlate with TRAIL Susceptibility (a) Representative western blots for cFLIPLong performed on total protein extracts of cell lines MCF-7, MDA-MB-231 (MD231), MDA-MB-468 (MD468) and MDA-MB-436 (MD436). Loading control = α-tubulin. (b) Western blots for cFLIPLong performed on total protein extracts of cell lines grown in adherent culture (Line) and non-adherent tumoursphere conditions (Spheres). Loading control = α-tubulin. (c) Western blots for cFLIPLong performed on cytoplasmic protein extracts of cell lines. Loading control = α-tubulin. (d) Western blots for cFLIPLong performed on cytoplasmic protein extracts of cell lines grown in adherent (Line) or tumoursphere (Spheres) conditions. Loading control = α-tubulin. (e) Comparison of relative cytoplasmic cFLIP levels and relative TRAIL-susceptibility (normalised to that of the MCF-7 line). SKBR3 and MDA-MB-468 datapoints overlap (*SKBR3 n = 2) (r = −0.98 > −0.99, Pearson’s correlation co-efficient). (f) Comparison of relative cytoplasmic cFLIP levels and relative TRAIL-susceptibility in bCSC-enriched non-adherent tumourspheres (normalised to that of their bulk cell line) (r = −0.96 < −0.95, Pearson correlation co-efficient). (g) Immunofluorescence of MCF-7 and MDA-MB-231 cells for cFLIP (cFLIP = grey, DAPI = red) (h) Immunofluorescence of anoikis-resistant MCF-7 cells before and after TRAIL-treatment (cFLIP = grey and DAPI = red). All western blots and quantitative data are representative of 3 independent experiments. Quantitation of the mean relative levels of cFLIP in experiments (a-d) are presented in Additional file 1: Figure S2
