
Figure 3.
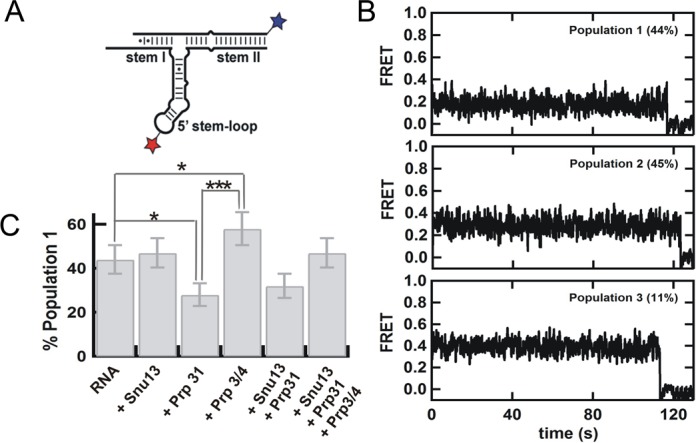
(A) Labeled construct to determine the orientation of stem II relative to the 5′ stem-loop by single-molecule FRET in the presence of the snRNP proteins (B) Representative single molecule trajectories for the three distinct populations observed by analysis of 102 trajectories in absence of proteins. (C) Changes in the fraction of population 1 in the presence of snRNP proteins in detriment of population 2. The fraction of population 3 remains constant under all conditions. P values are calculated using t-test and represent as * −P < 0.05, ** −P < 0.01 and *** −P < 0.001.