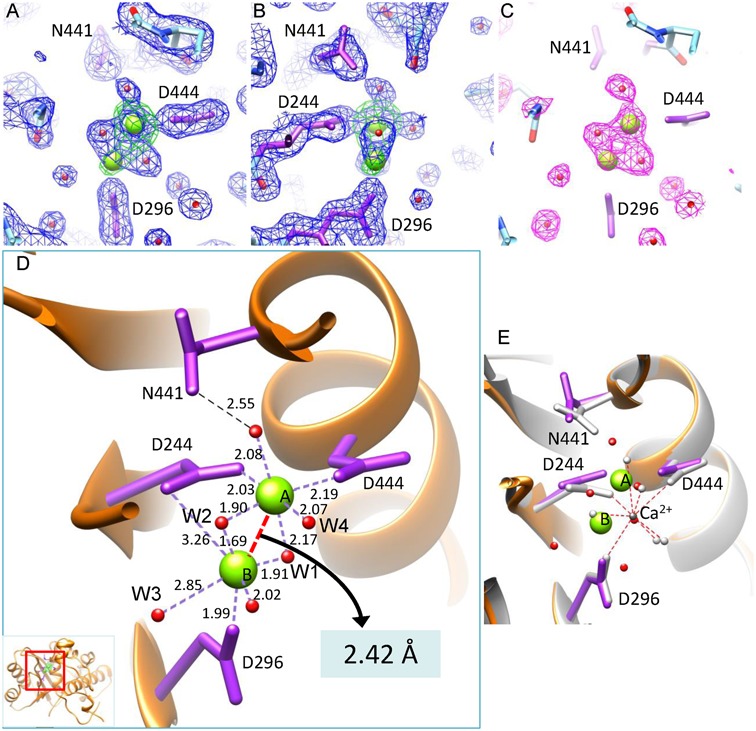
Figure 3.

The active site of gp2C–K428A:Mg2+. (A and B) The 1.52 Å resolution 2mFo–DFc electron density map of the gp2C–K428A:Mg2+ structure (blue mesh) contoured at 1.4 σ above background superimposed with the refined model. Green mesh, the anomalous difference map of gp2C–K428A:Mn2+ at 2.47 Å resolution contoured at 8.0 σ above background. Water molecules, spheres in magenta. H-bonds, dashed lines in red. (B) is 90° about the vertical axis from (A). (C) The mFo–DFc difference map (magenta mesh) prior to addition of water and metal ions into the model for refinement, contoured at 3.3 σ above background. The refined structure (stick model) is superimposed. (D) Binding of the two metal ions (green spheres) in the active site of the gp2C–K428A:Mg2+ structure (orange ribbon diagram). Side chains of residues D244, D296, D444 and N441 in the active site are shown as stick models in magenta. Water molecules, red spheres. The coordination bonds of the metal ions are shown as dashed lines in purple with lengths indicated. The distance between the two metal ions is indicated with a red dashed line. The inset shows the location of the figure in the protein. (E) Superimposition of the structures of gp2C–K428A:Mg2+ with gp2C–K428A:Ca2+ (grey). Side chains of residues D244, D296, D444 and N441 in the Ca2+-complexed structure are shown as stick models in grey. The bound Ca2+ is shown as a sphere in dark grey. The coordinating water molecules are shown as grey spheres, with interactions indicated with red dashed lines. The color scheme for the Mg2+-complexed structure is the same as in (D).
