Figure 4.

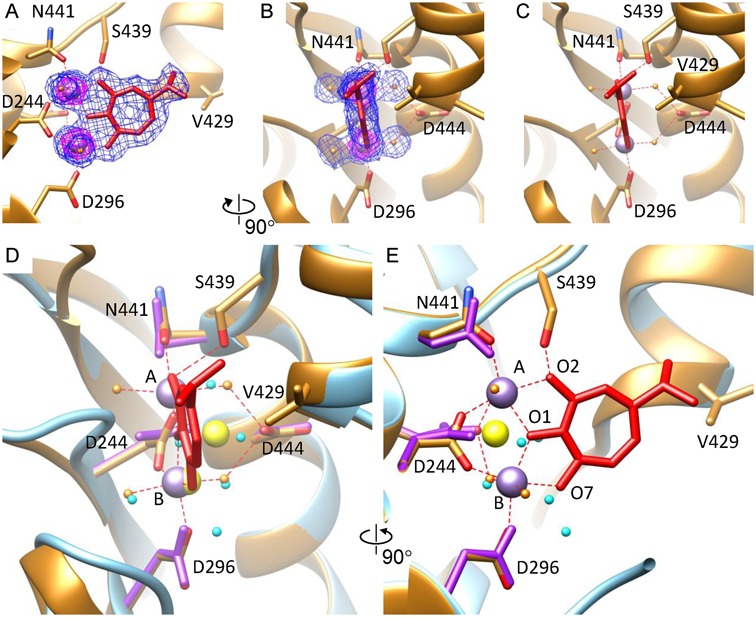
The metal ion binding mode in gp2C–K428A:Mn2+:BTP. (A and B) The gp2C–K428A:Mn2+:BTP structure (ribbon diagram in gold) superimposed with the 1.86 Å resolution 2mFo–DFc electron density map contoured at 1.0 σ (blue mesh) and 5.4 σ (magenta mesh) to show location of the two metal ions. Side chains of the active site residues as well as S439 and V429 are shown as stick models. BTP, red stick model. The two Mn2+, purple spheres. The four coordinating water molecules, gold spheres. (C) The local structure of gp2C–K428A:Mn2+:BTP showing planarity of the BTP tropolone ring and the slight deviation of the BTP plane with respect to the two metal ions. (D) and (E) Superimposition of structures of gp2C–K428A:Mn2+:BTP (gold) and gp2C–K428A:Mg2+ (cyan), where the bound metal ions are shown as purple and yellow spheres and water molecules in gold and cyan, respectively. Metal:ligand bonds in gp2C–K428A:Mn2+:BTP are indicated with red dashed lines. The view in (E) is 90° about the vertical axis from that in (D). Notice the change in position and coordination interactions for Metal ion A.
