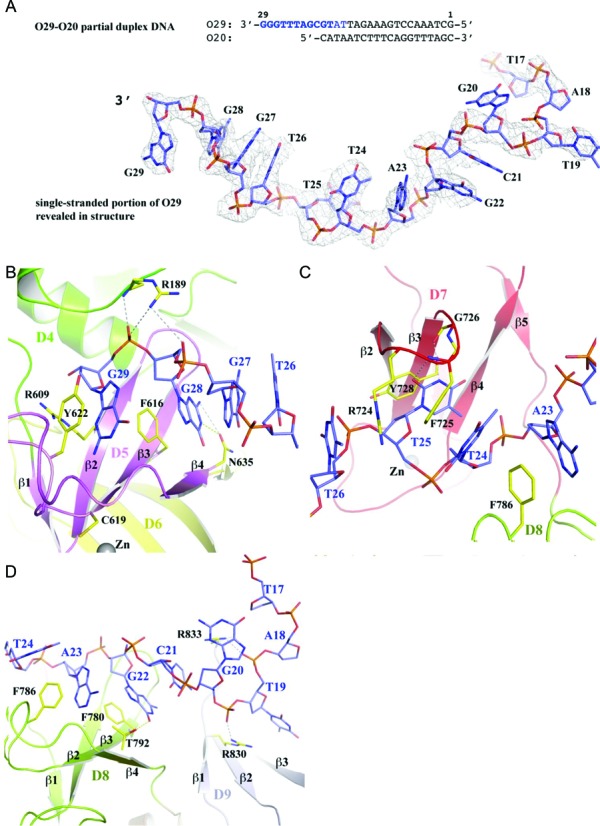
Figure 4.

ssDNA binding to EcTOP1 C-terminal domains. (A) The oligo O29-O20 partial duplex used for co-crystallization with EcTOP1. The overhang of the 3′-end of O29 oligo represents a ssDNA segment that is bound to the C-terminal domains of EcTOP1. The nucleotides that were observed in the structure are highlighted in dark blue. The two nucleotides that are highlighted in light blue have disordered bases. Other parts of the oligo O29-O20 are completely disordered. The electron density drawn in gray mesh for the ssDNA segment of the DNA bound to the C-terminal domains is calculated from a weighted 2Fo-Fc map and contoured at 1σ level. (B) The interactions between the 3′-end of ssDNA with the first C-terminal domain D5 as well as the last N-terminal domain D4. Only one coordinating cysteine of the Zn(II), C619, is shown for the purpose of discussion. D6 colored in yellow is not involved in ssDNA binding. (C) The interactions between ssDNA and D7. (D) The interactions between ssDNA and D8 and D9.
