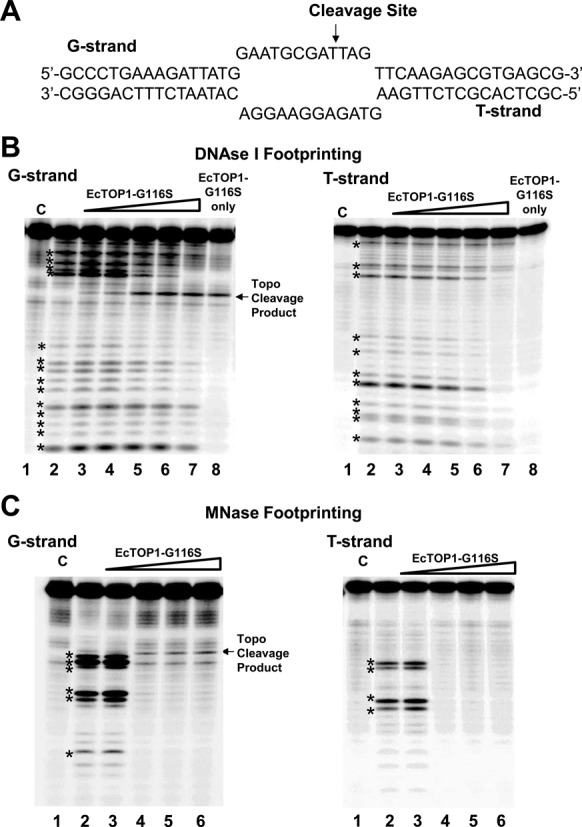
Figure 9.

Nuclease footprinting with DNA bubble substrate. (A) Sequence of top (G-strand) and bottom (T-strand) of DNA bubble substrate. The topoisomerase I cleavage site is shown by arrow on the G-strand. Nuclease footprint of EcTOP1-G116S on the bubble substrate is followed by 5′ 32P end-labeling of either the G-strand or T-strand. (B) DNase I footprinting. Lane 1: Control (C), DNA only; Lane 2: Nuclease only; Lanes 3–7: 10, 20, 40, 60, 100 ng ETOP-G116S followed by nuclease; Lane 8: 100 ng of EcTOP1-G116S only. (C) MNase footprinting. Lane 1: Control (C), DNA only; Lane 2: Nuclease only; Lanes 3–6: 10, 20, 40, 60 ng ETOP-G116S followed by nuclease. Nuclease cleavage products are denoted by * symbol.
