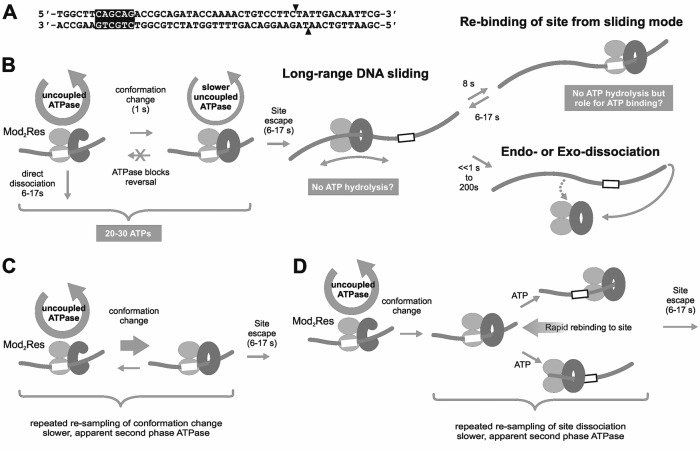
Figure 1.
Models for ATPase-coupled conformation switching to a DNA sliding state by Type III restriction-modification enzymes. (A) EcoP15I specific oligoduplex substrate (6/38_P15I) used here, and previously (4). Arrowheads indicate the sites of cleavage. The nomenclature reflects the position of the recognition site in the sequence; e.g. the CAGCAG recognition sequence is 6 base pairs from the 5′ end and 38 base pairs from the 3′ end. (B) Dual phase ATPase cycles proposed previously based on single molecule and biochemical studies (3,4,9,20). Mod subunits are shown as light grey ellipsoids. Res subunits are shown as a dark grey cee-shape (prior to the switch) or a dark grey circle (post-switch sliding state). The recognition site is a white box. (C) Alternative model where reversal of the conformation switch leads to the observed second burst phase of ATP hydrolysis. (D) Alternative model where rebinding to the site following initiation of sliding leads to the observed second burst phase of ATP hydrolysis. See main text for more details.

