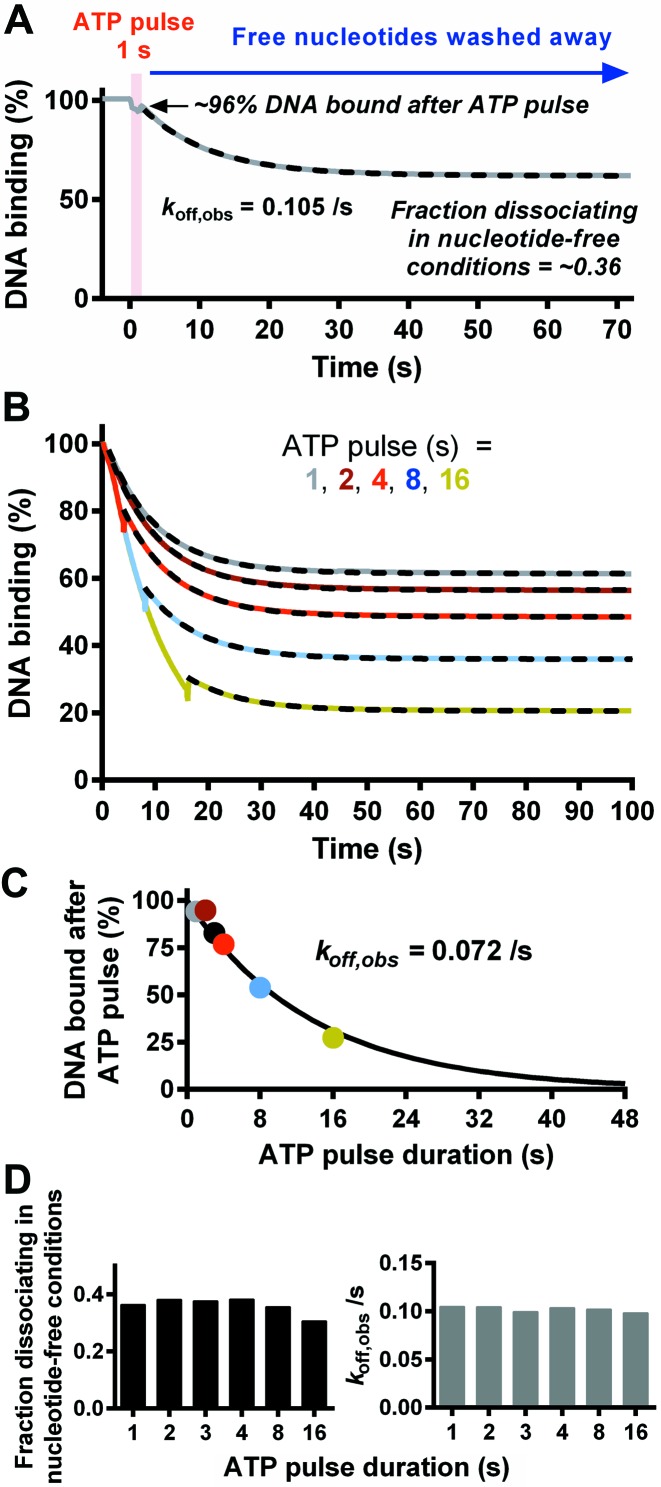
Figure 7.
The effect of transiently introducing ATP on the dissociation of EcoP15I from DNA. (A) EcoP15I-DNA dissociation measured in the SPR assay was initiated by injection of ATP for 1 s (red block) followed by Buffer R+ without nucleotide. The dashed line shows a fit to a single exponential function with incomplete dissociation. (B) Comparison of dissociation with variations in the times of ATP injection. Dashed lines are fits of the dissociation rate to a single exponential function following return to Buffer R+. (C) Percentage of DNA bound following the ATP pulse, as a function of ATP pulse duration. Colours are as in panel B. The data can be fitted with a single exponential function due to the kinetics of the underlying dissociation process. (D) Kinetic constants determined from single exponential fits to data in panel B. (Left graph) The fraction of enzymes remaining bound after the ATP pulse that subsequently dissociated during the ATP-free period. (Right graph) The rate constant for dissociation following the return to ATP free conditions (Buffer R+).

