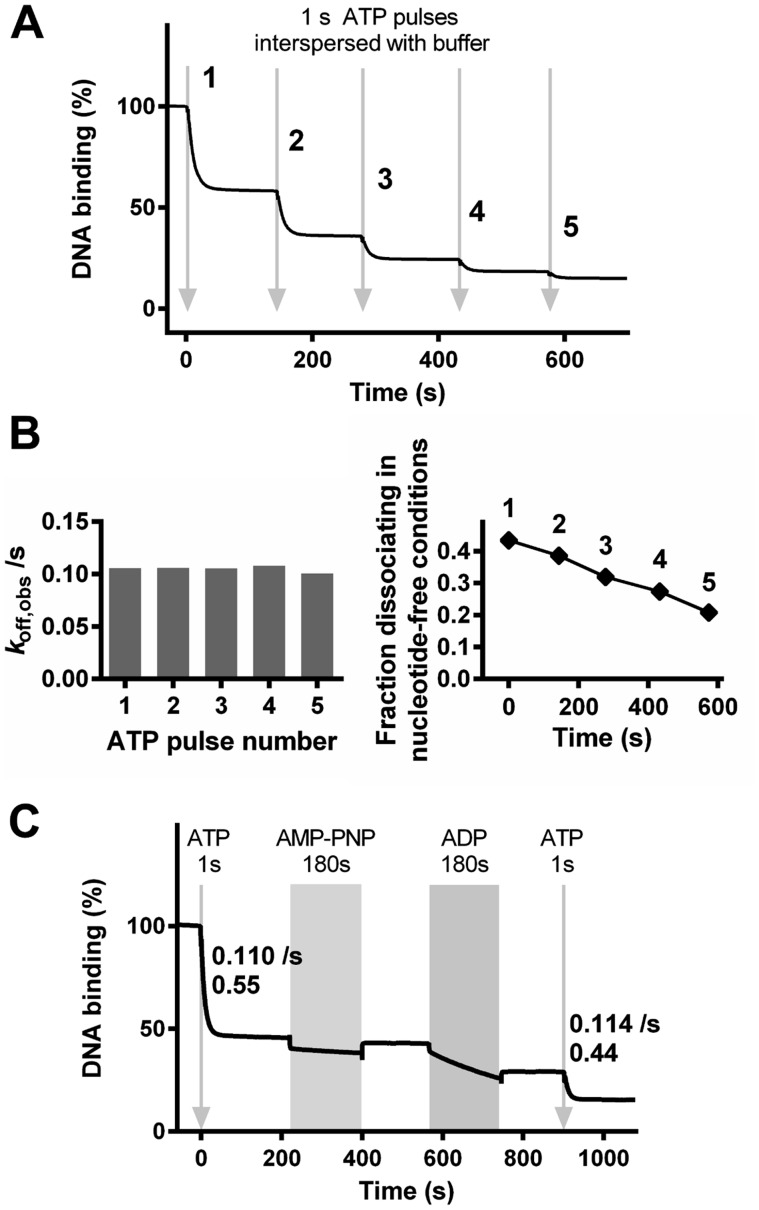
Figure 8.
The effect of consecutive nucleotide additions on DNA association and dissociation by EcoP15I. (A) EcoP15I-DNA dissociation measured in the SPR assay was initiated by consecutive injections of ATP for 1 s (arrows) followed in each case by Buffer R+ without nucleotide. (B) Kinetic constants are shown from fits of the EcoP15I–DNA dissociation profiles following each ATP pulse in panel A to an offset single exponential function. The change in the amplitude as a function of total reaction time appears approximately linear. (C) EcoP15I–DNA dissociation measured in the SPR assay was initiated by consecutive injections of: ATP for 1 s (arrow) followed by Buffer R+; AMP–PNP for 180 s (grey block) followed by Buffer R+; ADP for 180 s (grey block) followed by Buffer R+; and, ATP for 1 s (arrow) followed by Buffer R+. Kinetic rate constants and fractional amplitudes are shown for the single exponential dissociation produced by each ATP pulse.

