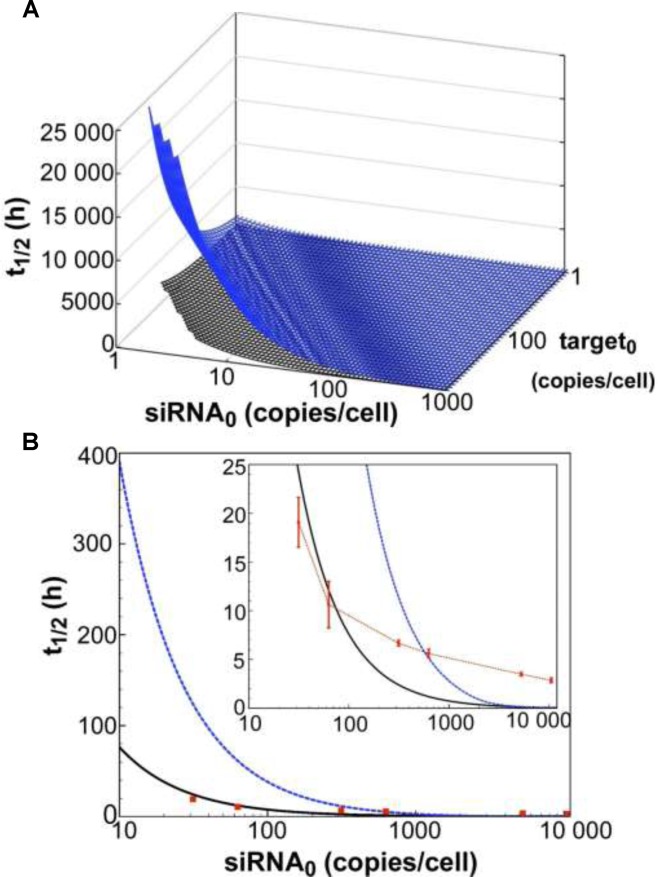
Figure 2.
Dependency of observed rate of target knockdown on siRNA and target mRNA concentration. (A) t , the time of half-maximal target knockdown, is plotted against logarithmically-scaled initial siRNA concentration and logarithmically-scaled basal target concentration. t
 of dissociative and associative model span the blue and the black surface over the parameter space, respectively. (B) It shows a cross-section of the 3D-plot at a basal target concentration of 35 copies/cell (experimentally determined luciferase mRNA copy number in stably transfected HTOL cells). For decreasing siRNA concentrations, the difference in t
 between the dissociative (blue line) and the associative (black line) model increases progressively. Experimentally determined t
 values of knockdown of luciferase reporter gene activity after LF2000-mediated transfection of different amounts of siR206 into HTOL cells are depicted by red squares. Transfection of 0.05, 0.1, 0.5, 1, 50 and 100 nM siRNA in the transfection mix translates into 31, 63, 314, 628, 5261 and 10 523 copies of bioavailable siR206 per cell (Supplementary Figure S1). For details see Materials and Methods and references (49,53). The corresponding t1/2 values are: 19 (± 2.5), 10.6 (± 2.4), 6.7 (± 0.3), 5.6 (± 0.4), 3.5 (± 0.2) and 2.9 (± 0.25) h (for experimental details see Supplementary Figure S7). The data are an average of at least two independent experiments. The inset shows the graph on a shorter y-axis scale including corresponding error bars.

