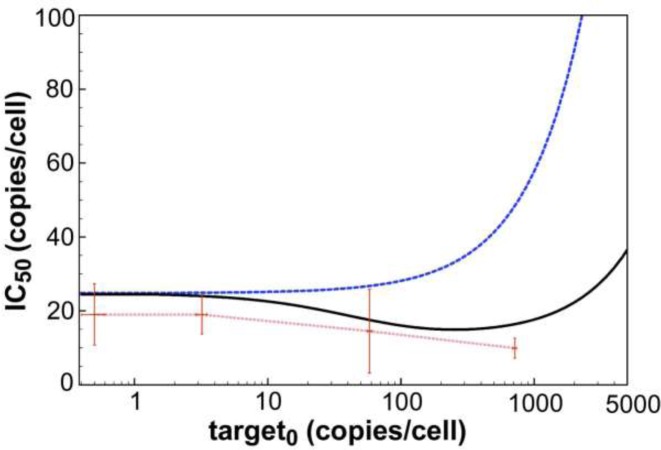
Figure 4.
Dependency of RNAi efficacy on target mRNA concentration. For both models (dissociative: blue line; associative: black line), simulated IC50 values (specified as copies/cell; conversion given under Materials and Methods) are plotted against logarithmically-scaled basal target mRNA concentration. Experimentally determined IC50 values of siR206 are shown by red dots. Here, siR206 (0.0005, 0.005, 0.05, 0.5, 5 and 50 nM) and pTRE2hyg-luc plasmid (0.1, 1, 10 and 100 ng/well) were cotransfected into HTO cells. In the absence of siRNA 0.5 (±0.1), 3.2 (±0.3), 58 (±2), and 715 (±23) luciferase mRNA copies/cell were determined by qPCR for the different amounts of plasmid transfected. For each concentration of pTRE2hyg-luc plasmid, IC50 values were determined by plotting qPCR-derived mRNA copy numbers versus concentrations of transfected siR206 yielding the following values: 0.1 ng plasmid/well = IC50 19 (±8), 1 ng plasmid/well = IC50 19 (±5), 10 ng plasmid/well = IC50 15 (±11) and 100 ng plasmid/well = IC50 10 (±2) copies/cell. Standard deviations are given by horizontal and vertical error bars.

