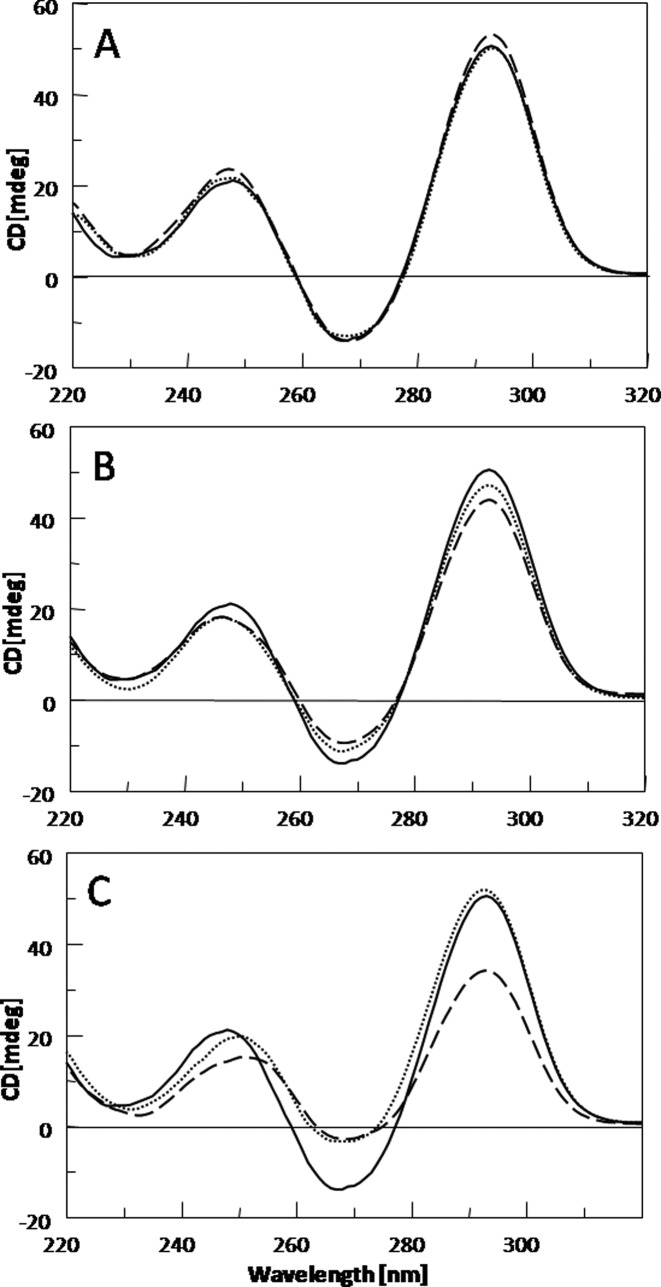
Figure 2.
CD spectra at 20°C of modified TBAs and their natural counterpart (solid line) at 100 μM ODN strand concentration in a buffer solution 10 mM KH2PO4/K2HPO4, 70 mM KCl (pH 7.0). (A) TBA-F4 (dotted line) and TBA-F13 (dashed line); (B) TBA-F3 (dotted line) and TBA-F12 (dashed line); (C) TBA-F9 (dotted line) and TBA-F7 (dashed line).

