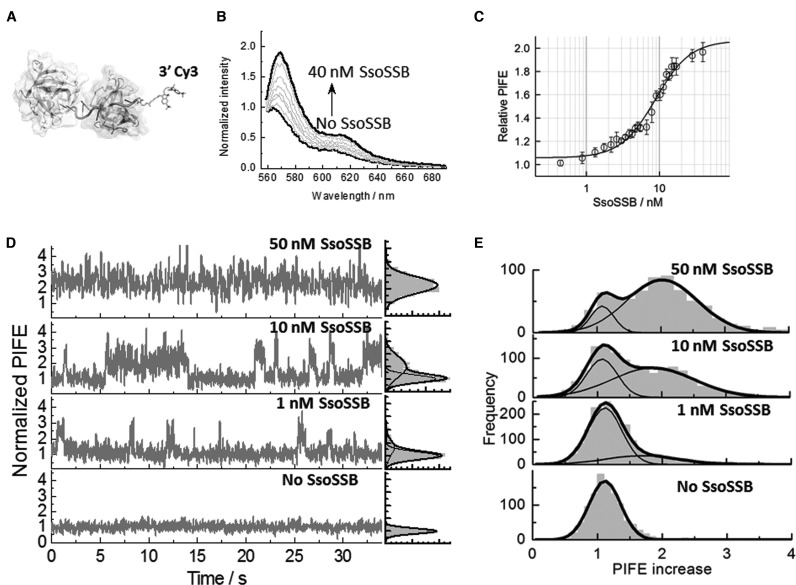
Figure 1.
SsoSSB binding to a 12-mer single-strand DNA monitored by protein-induced fluorescence enhancement (PIFE). (A) Molecular modelling of SsoSSB monomers (see Supplementary section for details) bound to a 12-mer Cy3-labelled single strand. (B) Fluorescence emission spectra of the Cy3 fluorophore inserted at the 3′ termini of a 12-mer dC sequence as a function of SsoSSB concentration. The fluorescence spectrum in the absence of SsoSSB was normalized to unity at the wavelength of the maximum and taken as a reference to calculate the relative increase in emission intensity at each SsoSSB concentration. (C) Relative variation in emission intensity of Cy3 normalized with respect to the emission intensity obtained in the absence of SsoSSB in a background of 10 mM KCl. Values represent the average of three experiments and are given as mean ± s.e.m. Solid line indicates the non-linear squares fit to Equation S1 as described in the Supplementary section. KD and Hill coefficient values of 9 ± 1 nM and 1.8 ± 0.2 were obtained, respectively. (D) Representative single-molecule trajectories of Cy3 emission intensity obtained at the indicated concentrations of SsoSSB with 50 ms integration time. SsoSSB association and dissociation can be observed as PIFE events in the single molecule trace. The raw Cy3 intensity in the absence of DNA has been normalized to unity and this has been taken as the signal reference for the single-molecule trajectories to quantify the relative increase in Cy3 intensity due to SsoSSB binding. Corresponding single-molecule PIFE histograms for each trace are also shown on the right panels. (E) Cumulative single-molecule histograms and Gaussian fitting (solid lines) of normalized Cy3 intensity built from >1000 molecules at each concentration of SsoSSB.

