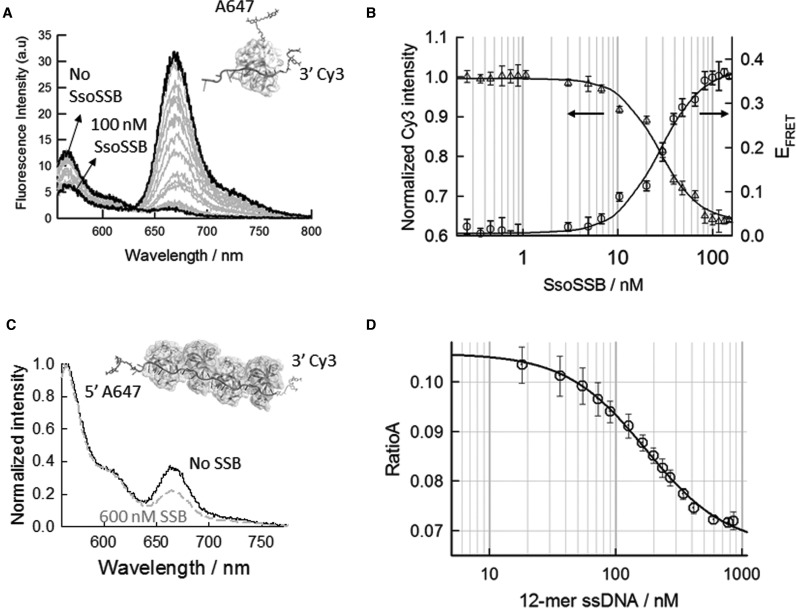
Figure 3.
SsoSSB binding to ssDNA and associated conformational changes monitored by intra- and intermolecular FRET. (A) Intermolecular FRET assay to monitor Alexa647-labelled SsoSSB binding to 12-mer dC ssDNA strand labelled with the FRET donor Cy3. The fluorescence spectra of Cy3 and Alexa647 was collected in the range 555–800 nm upon excitation of the donor at 547 nm as function of increasing concentrations of Alexa647-SsoSSB. (B) FRET binding isotherm and normalized Cy3 donor intensity as a function of SsoSSB concentration. Plotted values represent the average of three experiments and are given as mean ± s.e.m. Solid lines represent the non-linear squares fit to a Hill model (see Supplementary section for details). (C) Intramolecular FRET assay to monitor conformational changes in a 39-mer dC ssDNA induced by SsoSSB binding. Fluorescence spectra of Cy3 and Alexa647 normalized at the maximum of the Cy3 emission band (565 nm) in the absence and presence of 600 nM SsoSSB are shown. (D) Variation in the RatioA value as a function of SsoSSB concentration. RatioA values were calculated as described in the Supplementary section and represent the average of three experiments. The solid lines indicates the results from a non-linear squares fit to Equation S1 as described in the Supplementary section. KD and Hill coefficient values of 174 ± 20 nM and 1.4 ± 0.2 were obtained, respectively.

