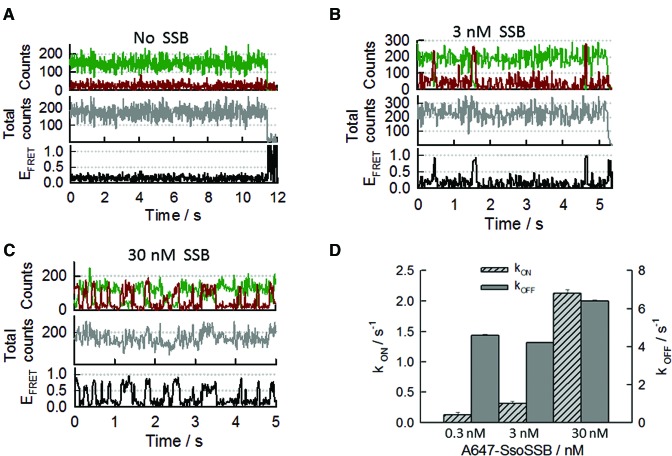
Figure 4.
Real-time single-molecule intermolecular FRET measurements of SsoSSB binding to a 20-mer ssDNA (BidC20Cy3). The DNA was labelled at the 3′ terminus with the Cy3 donor and immobilized on the quartz slide using biotin-streptavidin interactions. SsoSSB was labelled with Alexa647 as FRET acceptor (A) Single-molecule donor and acceptor trajectory (upper panel), total intensity (middle panel) and FRET trace (bottom panel) obtained in the absence of SsoSSB. Photobleaching of the Cy3 donor occurred at ∼11 s. (B) Representative single-molecule binding dynamics of Alexa647-SsoSSB to the BidC20Cy3 ssDNA. Anti-correlated fluctuations in the donorand acceptoremission signals (upper panel) are indicative of SsoSSB association and dissociation events. The corresponding PIFE and FRET trajectories are shown in the middle and bottom panel, respectively. (C) Representative single-molecule donor and acceptorintensity trajectory showing the binding dynamics of SsoSSB to BidC20Cy3 obtained at 30 nM concentration of Alexa647-labelled SsoSSB (upper panel). PIFE trajectory (middle panel) and FRET trace (bottom panel) are also shown. (D) Bar plot showing the association (kON) and dissociation (kOFF) rates in s−1 obtained for Alexa647-SsoSSB binding to BidC20Cy3 at the indicated concentrations of SsoSSB. Rates and associated errors were obtained from the fitting of the single-molecule dwell-time histograms to a mono-exponential decay function.

