Figure 1.
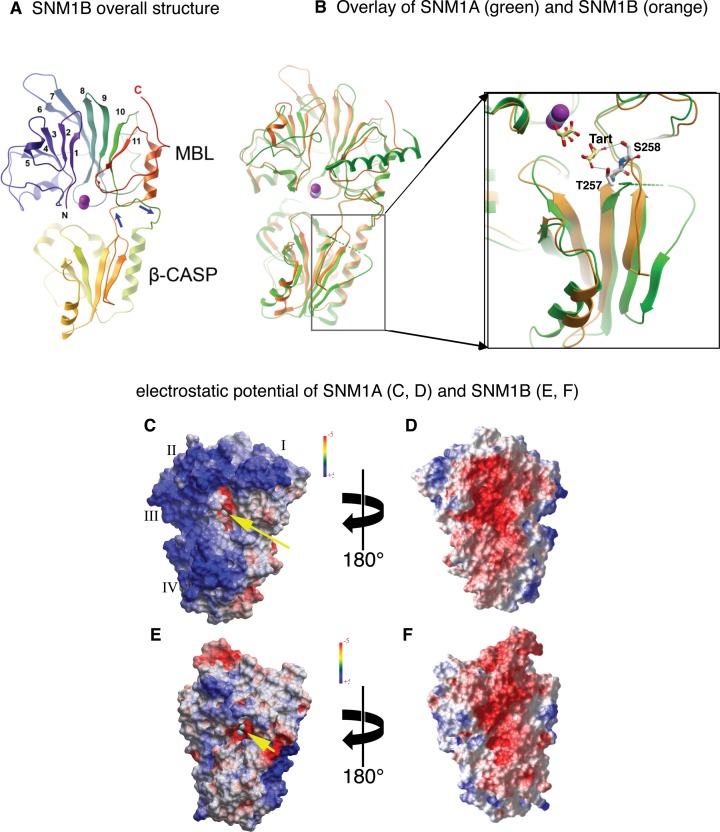
Overall structural features of SNM1A and SNM1B. (A) SNM1B, shown in cartoon representation. The N- and C-termini are indicated with N and C and in blue to red coloring. The numbers indicate the consecutive β strands of the MBL domain; the two zinc ions are shown as purple spheres. The β-CASP domain (bottom) is an insert between MBL strands 10 and 11, indicated by the blue arrows. (B) Overlay of SNM1A (green) and SNM1B (orange). The crystal structure of SNM1A includes only one zinc ion, shown in cyan. A region in the CASP domain (boxed, magnified) where the main chain trajectory is different between SNM1A and SNM1B. Hydrogen bonds between residues T257, S258 and a tartrate ion are shown. (C–F) electrostatic surface potential of SNM1A (C, D) and SNM1B (E, F), shown from two opposing orientations. Annotation in (C): yellow arrow points at the active site zinc shown in cyan). I, II, III and IV indicate patches of positive potential on the surface of SNM1A; the basic residues contributing to each patch are described in the text.

