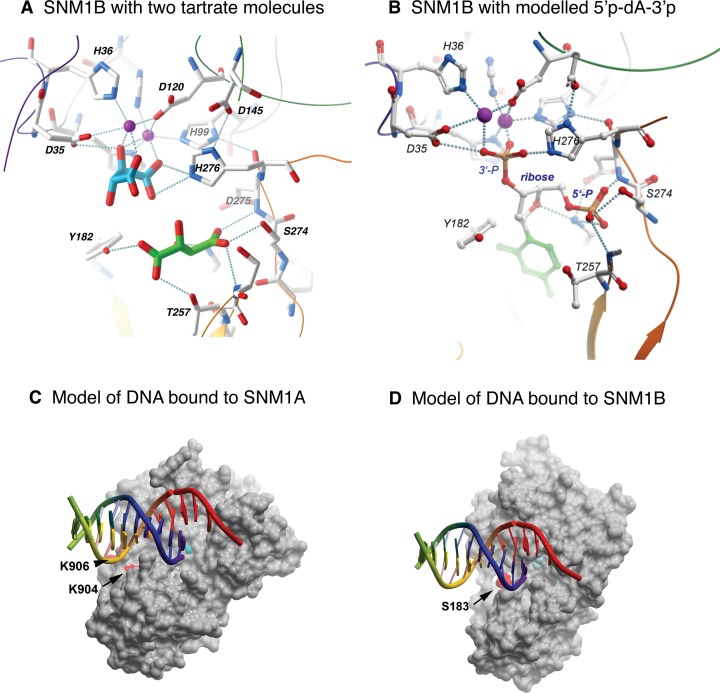
Figure 3.
Modeling substrate interactions of SNM1B and SNM1A. (A) Expanded view of the active site region of SNM1B, including the sulfate and tartarate ions that are bound in the crystal structure. (B) Modeling a 5′, 3′-nucleotide diphosphate based on the positions of the sulfate and tartarate in the crystal structure. The 5′ phosphate could represent the terminal phosphate of a DNA substrate, while the 3′ phosphate may represent the phosphodiester that is hydrolysed by the enzyme. (C) Model of DNA bound to SNM1A. The model places the 5′ end of one strand at the active site, while DNA downstream is in position to interact with the distal binding site defined by K904 or K906 (shown as red patches on the protein surface). (D) A similar model of DNA bound to SNM1B, where the distal DNA binding site includes S183 (red patch).

