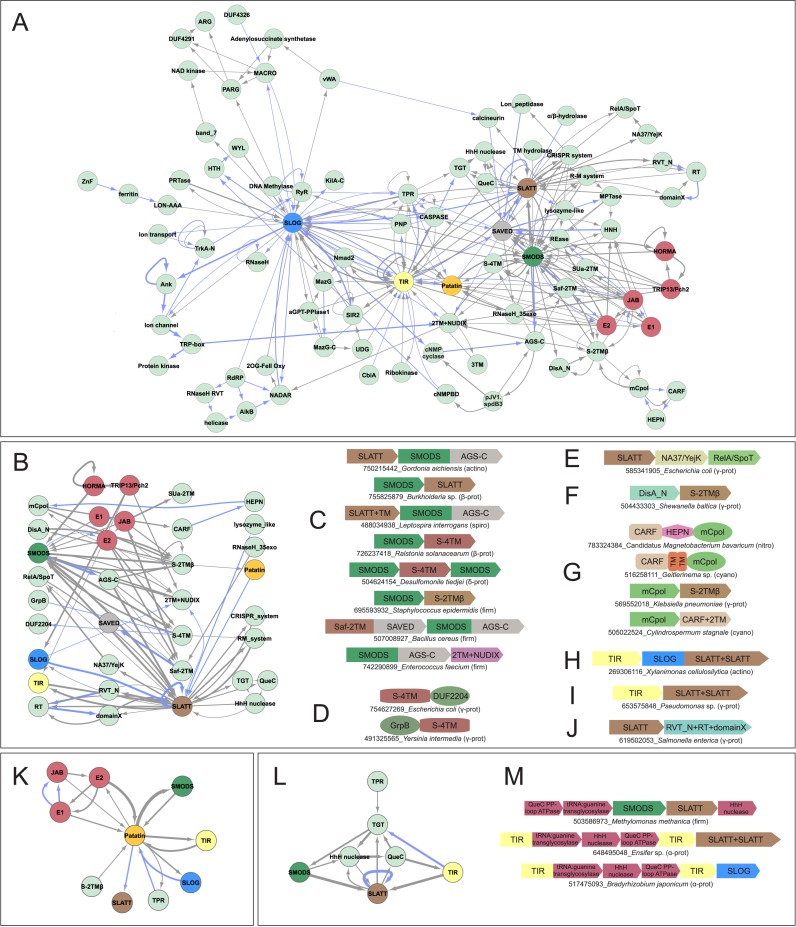
Figure 1.
(A) Genome context network overview of identified systems. Networks constructed as described in Materials and Methods, with blue edges representing domains directly fused in the same polypeptide and gray edges representing links in conserved gene neighborhoods. (B) Network depicting the relationship between nucleotide synthesizing and recognition/processing enzymes (left) with sensor/regulatory domains (middle left), TM-containing domains (middle right) and potential secondary effectors (right). (C–J) Representative depictions of conserved domain architectures and gene neighborhoods containing predicted TM pore-forming effectors (for comprehensive list of architectures and neighborhoods, see Supplementary Material). Domain architectures are depicted as adjacent shapes and are not drawn to scale. Gene neighborhoods are depicted as box arrows. Architectures and neighborhoods are labeled with NCBI gene identifier (gi) number and organism name, separated by underscore. Abbreviation of organism lineage is provided to the right of the label in parenthesis. Abbreviations: prot, proteobacteria; bacter, bacteroidetes; actino, actinobacteria; spiro, spirochaetes; firm, firmicutes; nitro, nitrospirae; cyano, cyanobacteria; plancto, planctomycetes; thermo, thermotogae; aquif, aquifex; tener, tenericutes; fuso, fusobacteria; euryarch, euryarchaea; chlorof, chloroflexi; deino, deinococci; euk, eukaryotes. (K) Network centered on the Patatin hub. (L and M) Network and gene neighborhood representation of newly-identified, preQ0-based R-M system.

