
Figure 7.
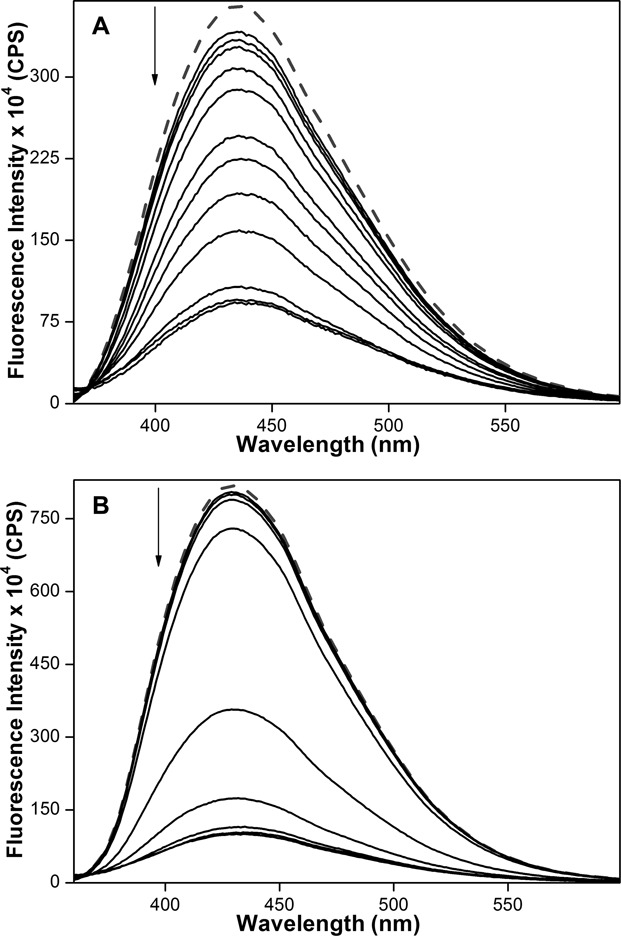
Emission spectra (solid lines) of mixed-type (A) and antiparallel (B) GQs of h-Telo DNA 5 (0.25 μM) in the presence of K+ and Na+ ions, respectively, with increasing concentrations of PDS. Dashed lines represent emission profile of GQs in the absence of PDS. ONs were excited at 330 nm with excitation and emission slit widths of 8 and 10 nm, respectively.