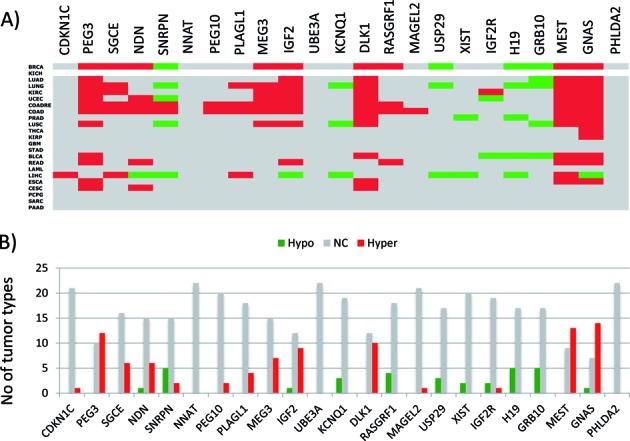
Figure 2.

DNA methylation level changes of imprinted genes in human cancers. (A) DNA methylation levels of imprinted genes (represented by columns) were compared between the primary tumor and normal solid tissue cells of various cancers (represented by rows) using TCGA database (The Cancer Genome Atlas). Statistically significant down- and upregulations were indicated by green and red boxes, respectively, while no significant change with gray boxes. The actual table used for this image is available as Supplementary Data 2. (B) This graph summarizes in how many cancer types the DNA methylation levels of each imprinted gene differ between the tumor and normal cells.
