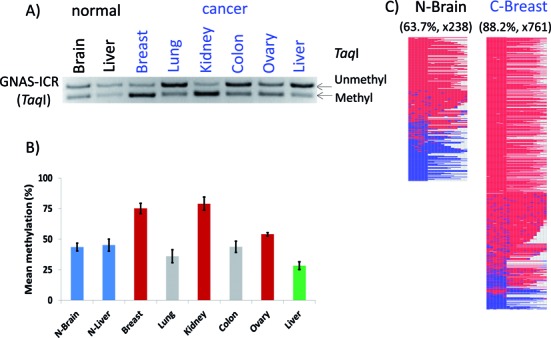
Figure 4.

DNA methylation analysis of GNAS-ICR. A set of human DNA derived from two normal (brain and liver) and six cancer tissues (breast, lung, kidney, colon, ovary and liver) were treated with the bisulfite conversion protocol, which were then analyzed with COBRA (A) and individual sequencing (C). For COBRA analyses, the PCR products from GNAS-ICR were digested with TaqI, displaying the unmethylated and methylated portion of each PCR product. The amounts of these two fragments from three independent trials were quantified based on their band density using ImageJ software, and mean methylation with 95% confidence intervals were plotted (B). As predicted, two normal tissues displayed 50% methylation levels on GNAS-ICR. On the other hand, three cancer tissues showed hypermethylation and one tissue displayed hypomethylation. All of these PCR products were also sequenced using a NGS platform, and the bisulfite sequence reads were analyzed with BiQ Analyzer HT Tool (C). Two representative graphic illustrations are shown: red and blue boxes indicate methylated and unmethylated CpG sites, respectively. The names of some of tissues start with either N- or C- to differentiate the origin of samples, normal and cancer tissues.
