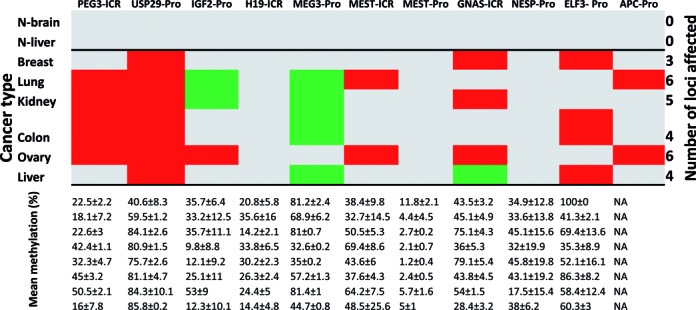
Figure 5.

Summary of DNA methylation level changes. A series of DNA methylation analyses on imprinted genes were conducted using a set of normal and cancer samples. The results were subsequently summarized with a table showing the average DNA methylation level and corresponding 95% confidence interval per each sample in a given tissue (bottom). Statistically significant changes relative to those observed from two normal tissues determined by t-test were also summarized in a separate table (top). In this table, red, green and gray boxes indicate hyper, hypomethylation and no change, respectively. It is important to note that some of ICRs and DMRs did not show 50% DNA methylation levels in normal tissues due to the technical issues that are mainly caused by inefficient restriction enzyme digestion.
