
Figure 3.
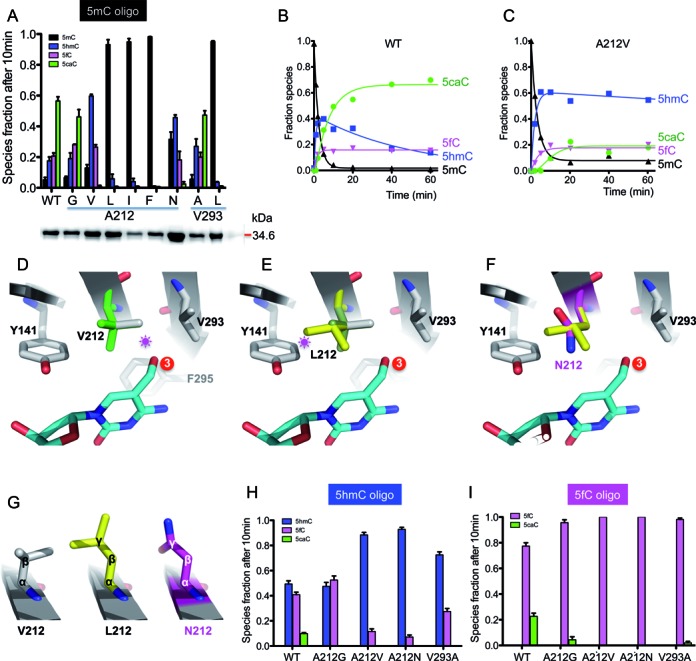
Oxidation activities of A212 and V293 mutants. (A) LC–MS/MS quantification of 5mC and its oxidized derivatives after a 10-min reaction of NgTet1 WT and variant proteins. Inserted is a SDS-PAGE gel (bottom) of the proteins (WT and 8 mutants) used for activity (see Supplemental Figure S3a). The protein concentrations were adjusted and equal amount of enzymes (WT and mutants) were used in each reaction. Error bars indicate standard error (s.e.) of the mean value from three independent experiments. (B and C) The time courses of quantitative LC–MS/MS measurements of 5mC (black) disappearance and formation of 5hmC (blue), 5fC (magenta) and 5caC (green) by WT (panel b) or 5hmC by A212V (panel c). (D) A model of V212 with two alternative conformations (in green or grey). The conformation in grey would clash with 5hmC (indicated by a star). (E) A model of L212. Only one of the three possible conformations was shown (in yellow), which would clash with Y141. The other two conformations would clash with V293 or F295 (in the background away from the reader). (F) A model of N212 (magenta) superimposed with L212 (yellow). The planar side chain conformation allowed N212 to be accommodated near Y141. (G) Comparison of V212, L212 and N212. (H and I) LC–MS/MS quantification of oxidation of a 5hmC- (panel G) or 5fC-containing oligo (panel h) after 10-min reactions of NgTet1 WT and mutant variants. Error bars indicate standard error (s.e.) of the mean value from three independent experiments.