Figure 4.

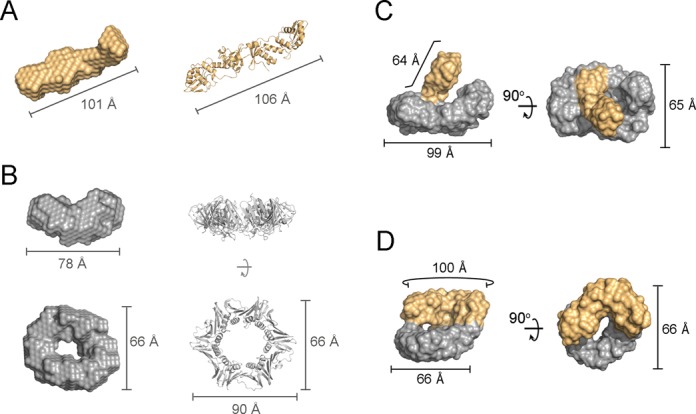
Structural models of the E. coli MutLCTD–β complexes. (A) Ab initio bead model of E. coli MutLCTD (eLC; orange) shown alongside its crystal structure (PDB ID: 1X9Z). (B) Orthogonal views of the refined ab initio model of the E. coli β-clamp (eβ; gray) compared to its crystal structure (PDB ID: 1MMI). (C and D) Orthogonal views of the representative models for each of the most populated clusters of eMutLCTD-eβ at ‘Day 1’ (C) and ‘Day 2’ (D). The moieties presumed to represent MutLCTD and β are highlighted in orange and grey. The overall dimensions of the bead models and crystal structures are indicated for reference.
