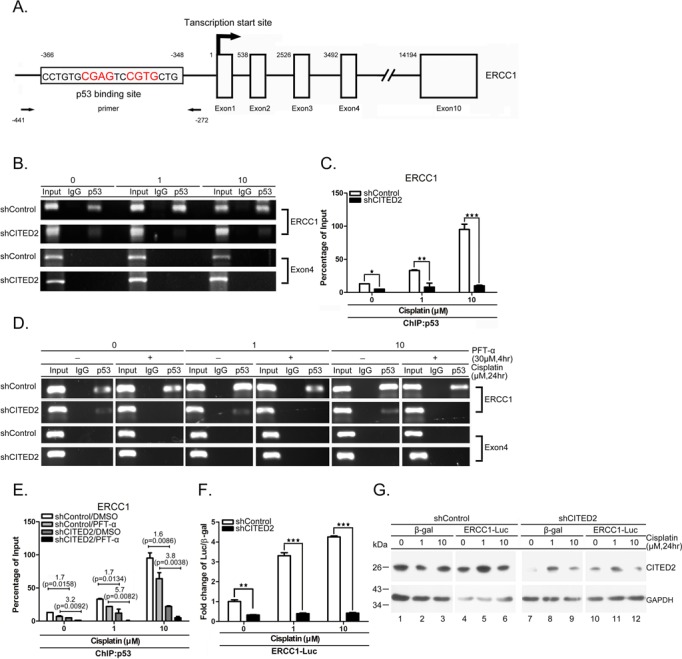
Figure 5.

Both basal and induced p53 binding to and transaction of ERCC1 promoter are reduced by shCITED2. (A) Schematic diagram of the promoter and regions of the ERCC1 gene. p53-binding site, transcription initiation site (+1), and exons are indicated. The positions of PCR primers and elements relative to transcription initiation site are indicated with numbers. (B) Representative gel photographs of ChIP PCR products: reduction of p53 binding to ERCC1 the promoter by shCITED2. Chromatin of cells with indicated treatments were immunoprecipitated with p53 antibody or IgG control The co-IP DNA was detected by qRT-PCR for the p53 binding region (ERCC1) or negative control region (Exon 4). (C) Quantification of ChIP DNA from (B) by qRT-PCR: reduction of p53 binding to the ERCC1 promoter following shCITED2 expression. The values of PCR products were normalized to individual input. (D) Representative gel photographs of ChIP PCR products: reduction of p53 binding to ERCC1 promoter by PFTα is partly prevented by shCITED2. Other symbols are the same as in (B). (E) Quantification of ChIP DNA from (D) by qPCR: reduction of p53 binding to ERCC1 promoter by PFTα is partly prevented by shCITED2. Fold difference of average mRNA levels and P-values are indicated (n = 3). (F) Cisplatin-induced ERCC1 promoter activity was reduced by shCITED2 expression. Results were presented as the luciferase activity normalized to β-gal activity as internal control for each treatment. (G) Representative immunoblots of proteins for experiment shown in (F).
