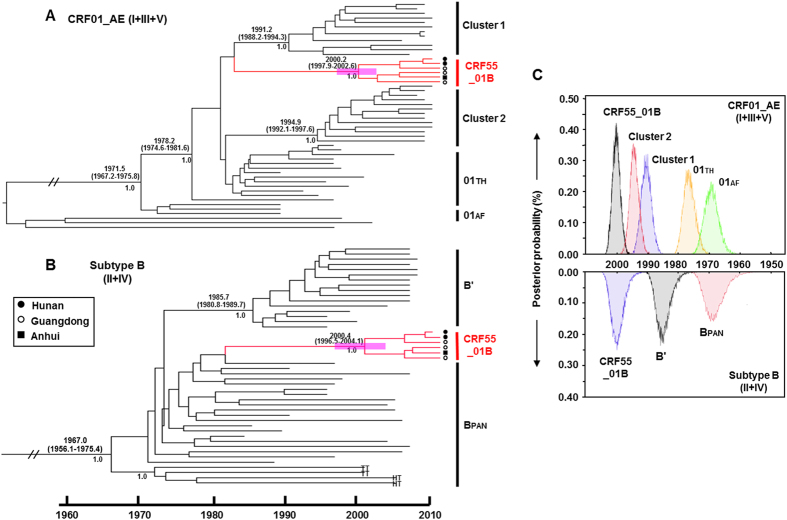
Figure 4. Maximum clade credibility (MCC) trees of CRF55_01B.
The MCC tree was obtained by performing Bayesian MCMC analysis of the concatenated CRF01_AE (Regions I + III + V) (A) and the subtype B region (Regions II + IV) (B), using a relaxed clock model in GTR + G4 with a constant coalescent model. Analyses were implemented in BEAST v.1.6.0. HIV-1 subtype C sequences are used as an outgroup. The medians of tMRCAs with 95% highest probability density (HPD) (in parenthesis) and the posterior probability ( > 0.95) of the nodes relevant to this study were shown. (C) The distribution of the posterior probability of the estimated tMRCAs for CRF55_01B and related lineages: CRF01_AE lineages (top) and subtype B lineage (bottom).

