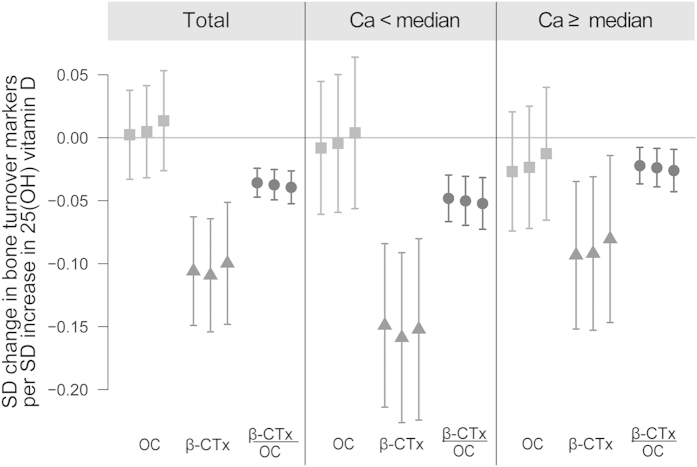
Figure 2. Results of linear regression on standardized values.
Description: Model 1: city, study, sex, fasting status, time of blood drawn; Model 2: Model 1 + BMI, BMI2, growth rate, detectable testosterone/estradiol; Model 3: Model 2 + maternal and paternal education, center specific income tertiles, single parent status) and physical activity.

