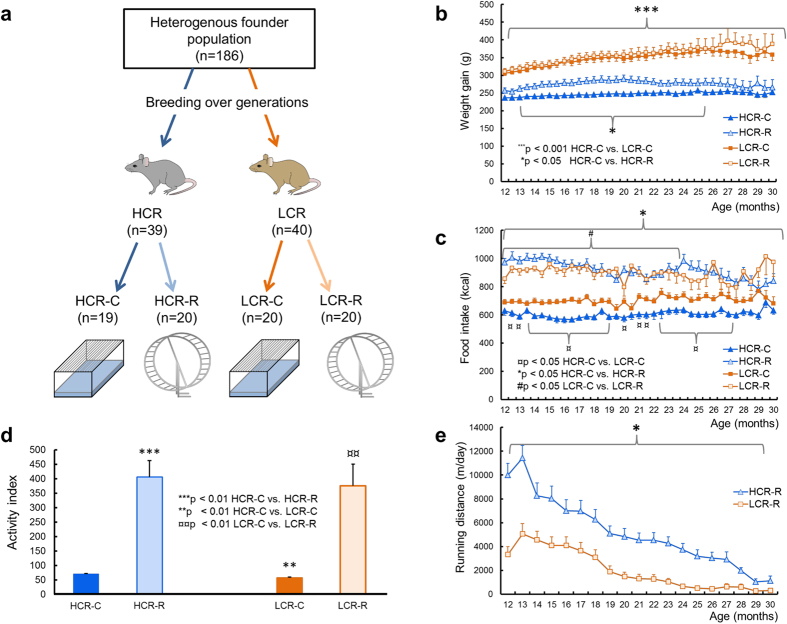
Figure 1. Rat study protocol and measurements.
(a) Schematic of study protocol. Rats were bred for high (HCR, blue) or low (LCR, orange) intrinsic fitness, then assigned to control (C) or running (R) subgroups. (b) Body weights from ages 12 to 30 months. Rats per group: 12 months: HCR-C = 18, HCR-R = 15, LCR-C = 20, and LCR-R = 20; 21 months: HCR-C = 19, HCR-R = 17, LCR-C = 18, and LCR-R = 13; 30 months: HCR-C = 12, HCR-R = 8, LCR-C = 7, and LCR-R = 3. (c) Food intakes from ages 12 to 30 months. Rats per group: same as in b), except at 12 months: HCR-C = 16. (d) Average daily spontaneous activity measured over 3 days between 13 and 15 months of age (activity index). Rats per group: 13 months: HCR-C = 18, HCR-R = 12, LCR-C = 20, and LCR-R = 11; 15 months: HCR-C = 19, HCR-R = 13, LCR-C = 19, and LCR-R = 10. (e) Average running distance per day. Rats per group: 12 months: HCR-R = 15 and LCR-R = 15; 21 months: HCR-R = 16 and LCR-R = 14; 30 months: HCR-R = 4 and LCR-R = 2. Error bars represent SEMs. Figure was drawn by Sira Karvinen.

