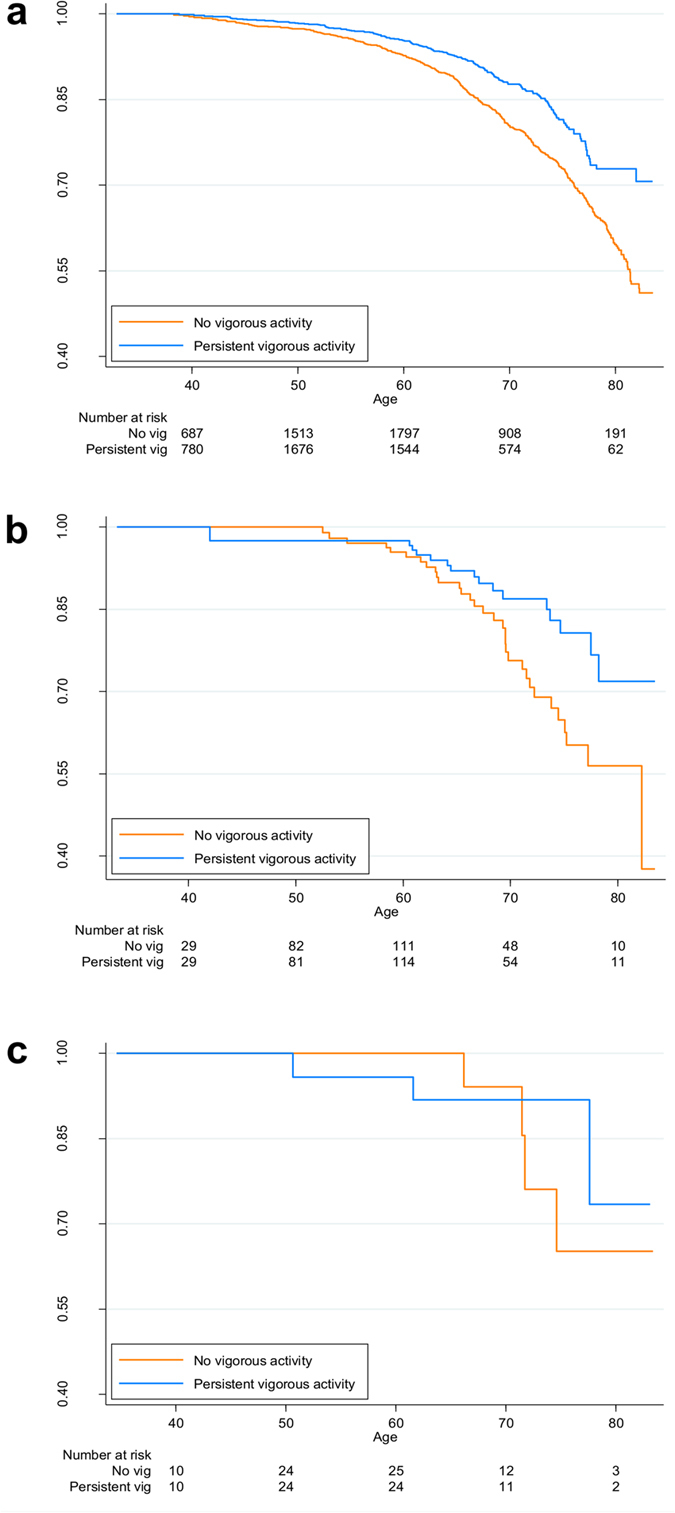
Figure 3. Kaplan-Meier survival curves of mortality in the human study.

Follow-up started from the date of the 1990 questionnaire response to the end of July 2013. Groups comprised individuals with no vigorous activity (orange) vs. those with persistent vigorous activity (blue) at baseline (start of follow-up). (a) Survival of 2428 individuals with no vigorous activity and 2145 individuals with persistent vigorous activity; (b) survival of 134 discordant DZ twin pairs; (c) survival of 34 discordant MZ twin pairs.
