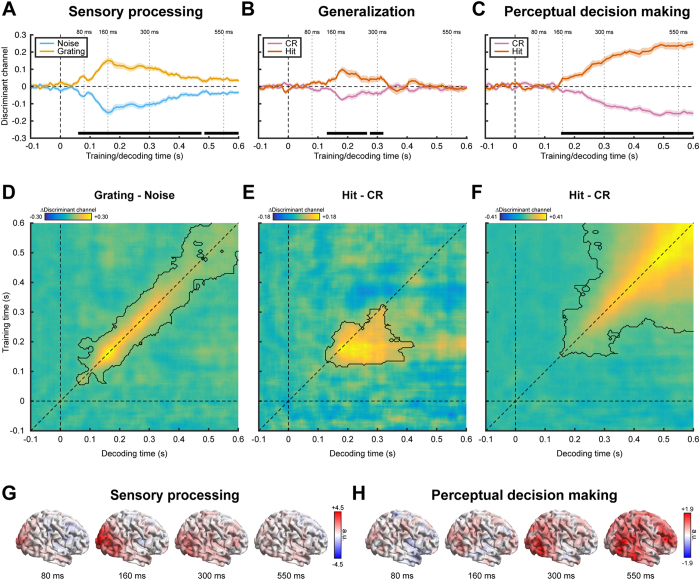
Figure 2. Decoding results for training and decoding within the functional localizer (A,D), for generalization from the functional localizer to correct perceptual decisions (B,E) and for training and decoding within correct perceptual decisions (C,F).
(A–C) Average discriminant channel activity for noise and grating trials (A) and CRs and hits (B,C), at matched training and decoding time. The horizontal black bars mark time points that belong to a significant cluster as outlined in (D–F). Shaded areas depict the SEM. (D–F) Temporal generalization matrices. Note that the diagonals are identical to the differences between the curves in (A–C) and note that the color scales are variable across figure for optimal visualization. Significant clusters are demarcated by the contours. (G,H) Source level contributions to the discriminant channel trained on the functional localizer (G) and on perceptual decision making (H), at four specific time points.

