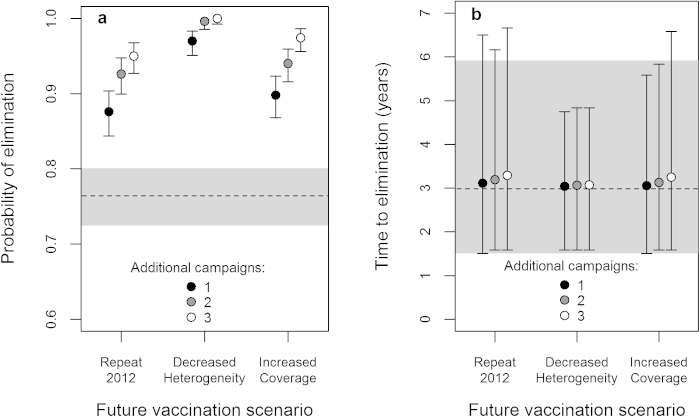
Figure 4. Comparison of rabies elimination prospects under future vaccination scenarios in Region VI.
(a) Probability of rabies elimination in Region VI following an additional 1, 2 or 3 vaccination campaigns, which were either repeats of the coverage pattern achieved in the most recent campaign in 2012 (Repeat 2012), or versions of the 2012 campaign with either heterogeneity in coverage decreased by half (Decreased Heterogeneity), or coverage in each barangay increased by 10% (Increased Coverage). Binomial 95% confidence intervals are indicated (bars). The probability of elimination (dashed line) with 95% confidence intervals (shaded area) already achieved following the three campaigns during 2010–2012 is shown for comparison (dashed line). (b) Time from onset of mass vaccination in 2010 to rabies elimination for the same scenarios as (a). Means (points) and 95 percentile intervals (bars) are based on simulations where elimination was successful. The mean (dashed line) and 95 percentile interval (shaded area) following the 2010–2012 campaigns are shown for comparison.

